The Maldives Import Trade Data
  • Product
  • HS Code
  • Company
The Top 10 Maldives Imports
As shown by Tendata's Maldives import data, the country's top 10 imports in 2024 are:

Mineral fuels, oils, distillation products(21.83%, $760.39 Million)

Machinery, nuclear reactors, boilers(9.59%, $334.09 Million)

Electrical, electronic equipment(7.85%, $273.37 Million)

Salt, sulphur, earth, stone, plaster, lime and cement(4.34%, $151.34 Million)

Articles of iron or steel(3.21%, $111.93 Million)

Aircraft, spacecraft(2.91%, $101.21 Million)

Dairy products, eggs, honey, edible products(2.76%, $96.18 Million)

Meat and edible meat offal(2.46%, $85.6 Million)

Plastics(2.46%, $85.53 Million)

Furniture, lighting signs, prefabricated buildings(2.44%, $84.94 Million)


These top 10 imports account for 59.83% of the Maldives's total imports in 2024. Businesses and analysts can leverage the following insights to understand trade trends, monetary values, and market dynamics in the Maldives
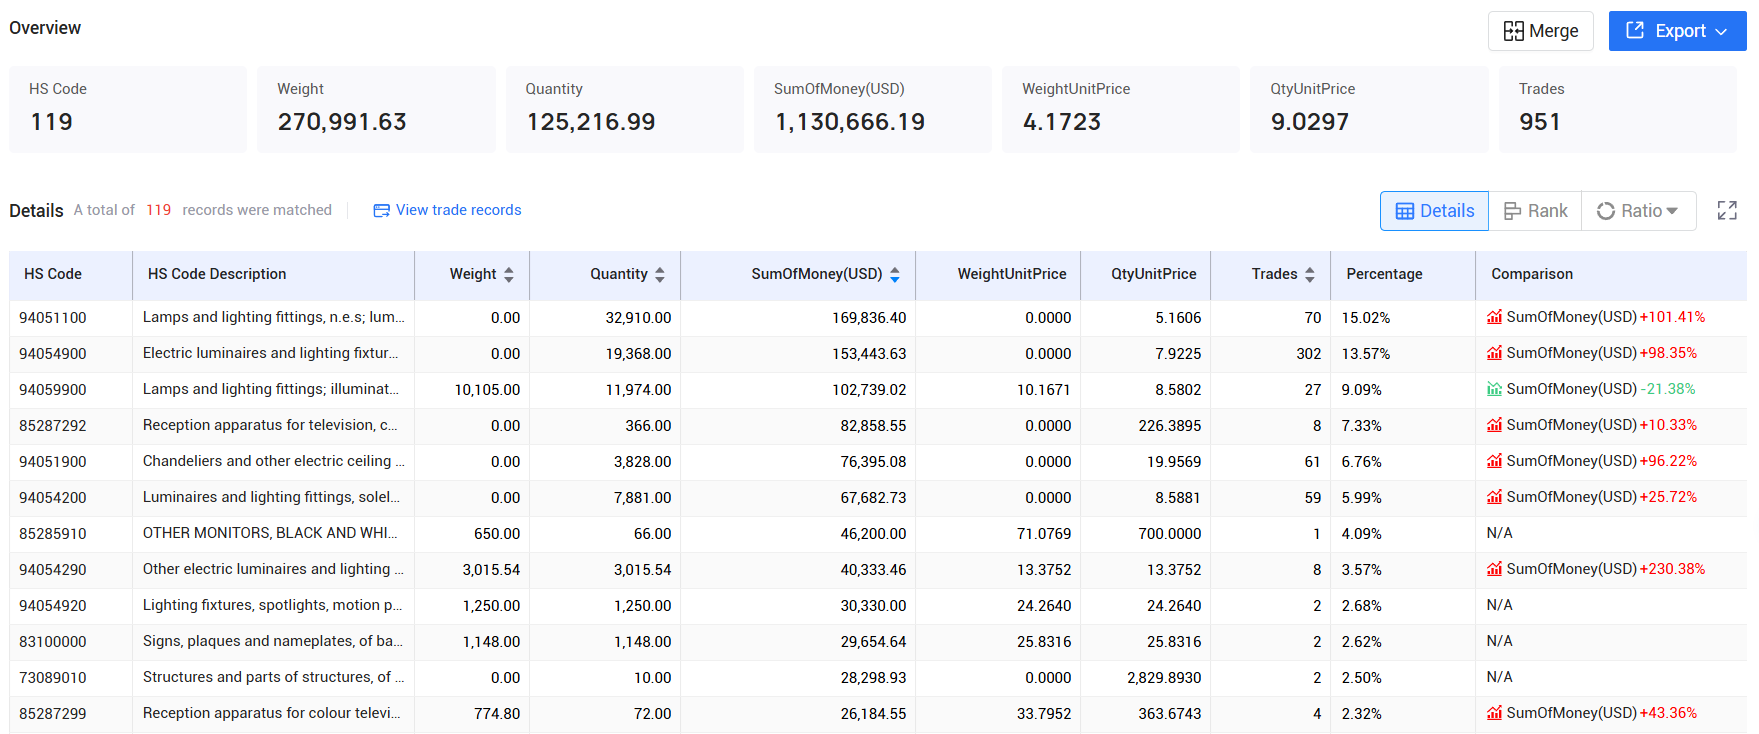
Tendata provides a complete list of HS codes, allowing you to understand which products are popular imports in the Maldives. The following uses "LED" as an example to show you Tendata's HS code report:
tendata itrader,import the maldives,export the maldives
Get The Full Maldives Import Products Report
Product Analysis
Tendata shows you the import profile of products worldwide and the Maldives, including trade volume, trade value, unit price, country of origin, etc. The following takes "onion" as an example to show you the import situation of this product in the world and the Maldives:

  • Origin

    55
  • Destination

    64
  • Customers

    12,017
  • Competitors

    16,554
  • Trades

    291,762
  • Quantity

    6,188,345,596.54
  • Weight(KG)

    10,946,676,469.43
  • Total Price(USD)

    3,251,115,876.15
  • Avg.Unit Qty Price(USD)

    2.21
  • Avg.Unit Wgt Price(USD)

    0.39
tengdao,importer the maldives,exporter the maldives
Product Price Analysis
Tendata provides Maldives enterprises with average price analysis for major and minor product categories. You can see the quarterly average import and export prices and compound annual growth rates in Tendata. You can easily understand which product has the highest import price/export price increase and the highest average price among major product categories and use it as a reference for your pricing.

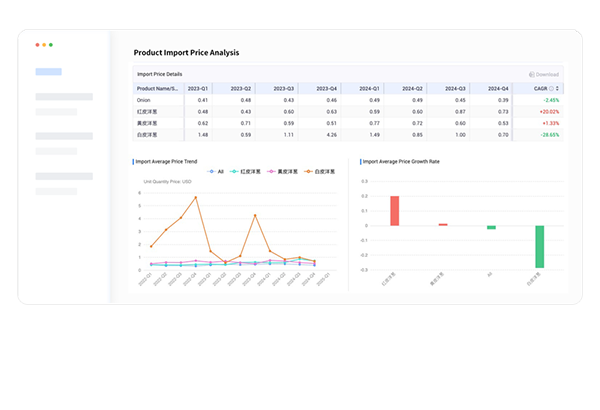
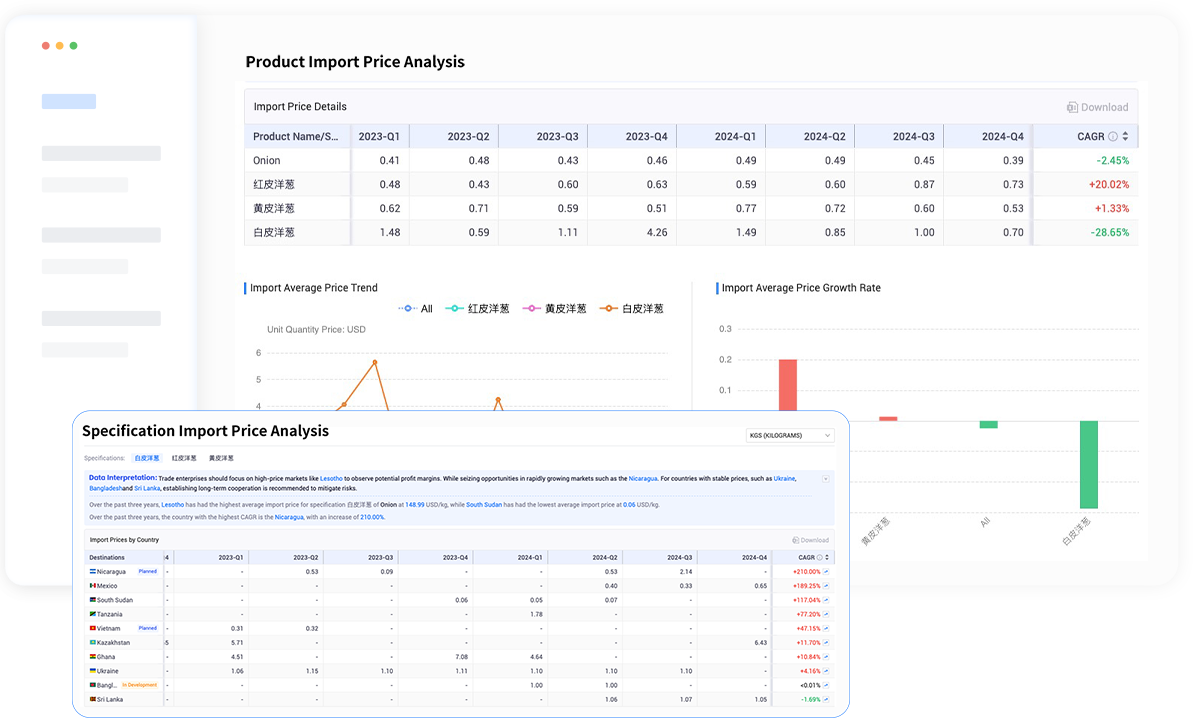
Average Import/Export Price

Average Price Trend

Average Price Growth Rate

Request A Free Demo
Related Product Analysis
At Tendata, you can see other products purchased by customers and those supplied by competitors, providing you with strategic references for developing different products.
Get A Free Demo
Grace
Sales Representative
  • emarketing@tendata.cn

  • +86 187-2199-2033

Get a Free Demo