Singapore Export Trade Data
  • Product
  • HS Code
  • Company
The Top 10 Singapore Exports
According to Tendata's Singapore export data, the top exports from the country in 2024 are primarily:

Electrical, electronic equipment(34.02%, $161.7 Billion)

Machinery, nuclear reactors, boilers(15.59%, $74.13 Billion)

Mineral fuels, oils, distillation products(12.38%, $58.86 Billion)

Commodities not specified according to kind(6.8%, $32.32 Billion)

Optical, photo, technical, medical apparatus(4.94%, $23.5 Billion)

Pearls, precious stones, metals, coins(3.95%, $18.79 Billion)

Organic chemicals(3.07%, $14.57 Billion)

Plastics(2.65%, $12.61 Billion)

Pharmaceutical products(2.32%, $11.04 Billion)

Essential oils, perfumes, cosmetics, toileteries(2%, $9.53 Billion)


These top 10 exports represent 87.73% of Singaporean imports in 2024. The following charts provide deeper insights for businesses and market analysts, highlighting the monetary value and market trends of the top 10 Singapore exports in 2024.
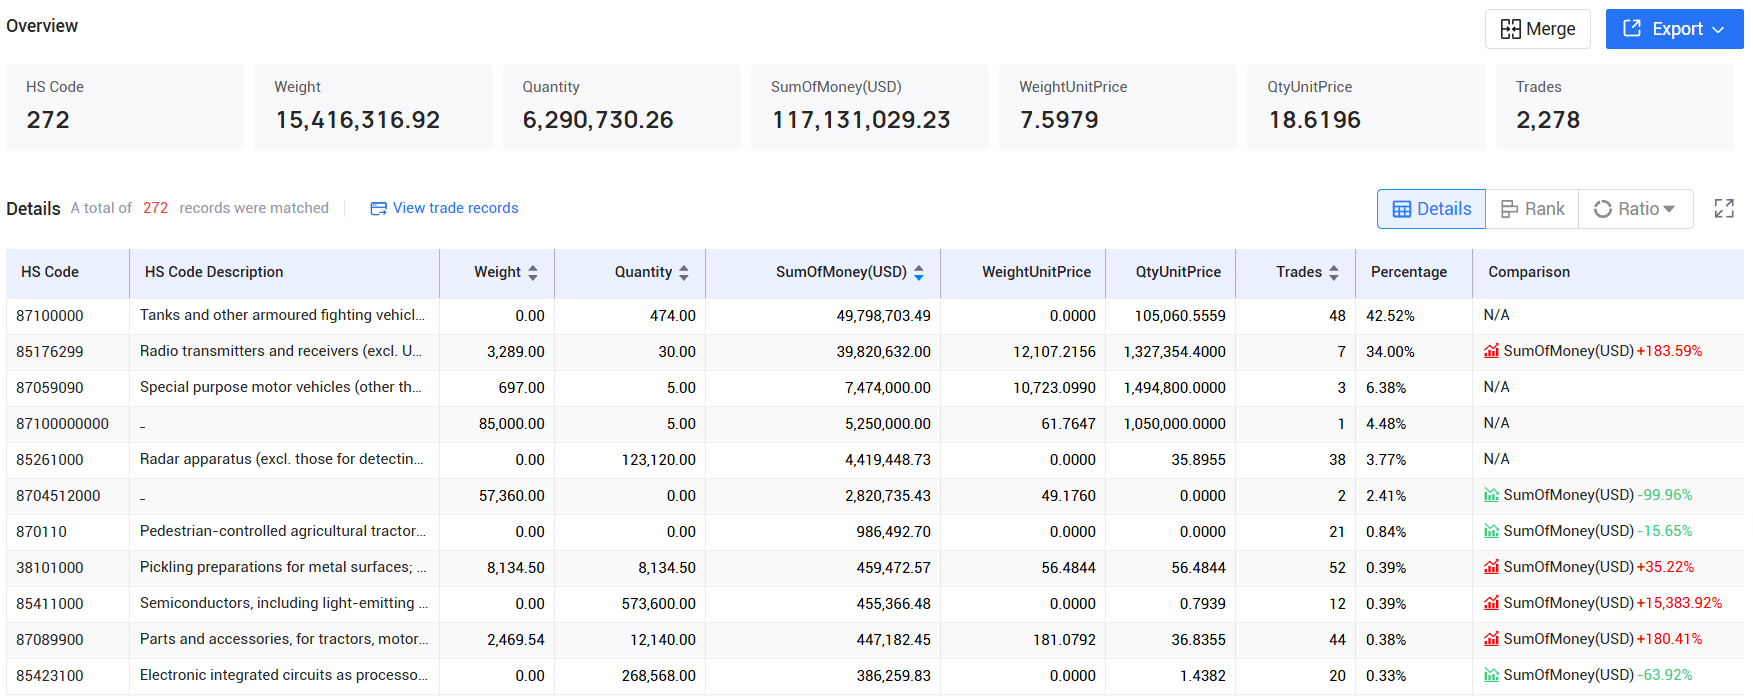
Tendata offers a comprehensive list of HS codes, helping you identify which specific products are the most popular exports from Singapore. The following takes "vehicles" as an example to show Tendata's HS code report:
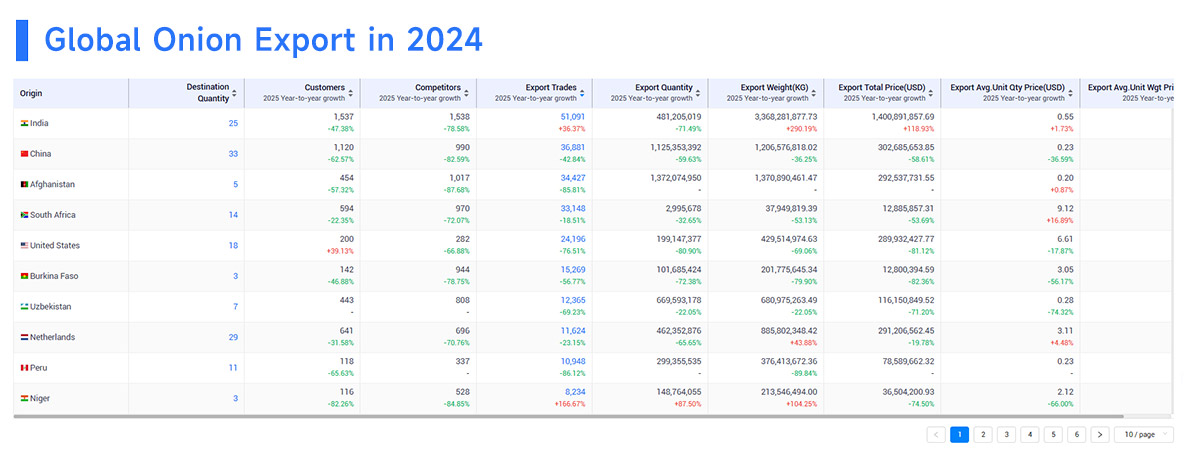
tendata itrader,import singapore,export singapore
Get The Full Singapore Export Products Report
Product Analysis
Tendata shows you the export profile of products worldwide and in Singapore, including trade volume, trade value, unit price, country of origin, etc. The following takes "onion" as an example to show you the export situation of this product around the world and in Singapore:

  • Origin

    55
  • Destination

    64
  • Customers

    12,017
  • Competitors

    16,554
  • Trades

    291,762
  • Quantity

    6,188,345,596.54
  • Weight(KG)

    10,946,676,469.43
  • Total Price(USD)

    3,251,115,876.15
  • Avg.Unit Qty Price(USD)

    2.21
  • Avg.Unit Wgt Price(USD)

    0.39
tengdao,importer singapore,exporter singapore
Product Price Analysis
Tendata offers Singaporean businesses a comprehensive analysis of average prices across major and minor product categories. You can view quarterly average import and export prices and compound annual growth rates (CAGR) in Tendata. This lets you quickly identify which products have seen the highest increases in import/export prices and the highest average prices within key categories, giving you valuable insights for setting your pricing strategy.

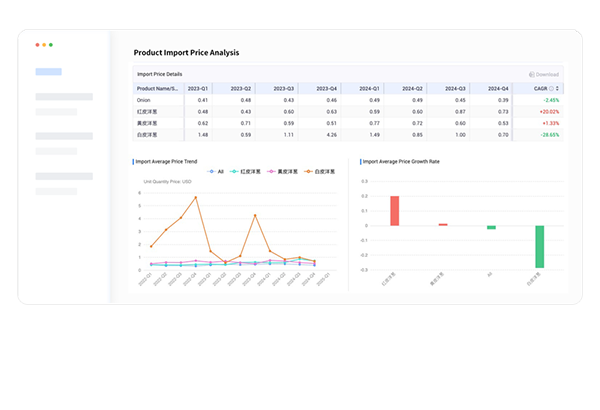
Average Import/Export Price

Average Price Trend

Average Price Growth Rate

Request A Free Demo
Related Product Analysis
With Tendata, you can explore other products purchased by your customers and those supplied by your competitors. This valuable data provides strategic insights to help you expand your product offerings and refine your market approach.
Get A Free Demo
Grace
Sales Representative
  • emarketing@tendata.cn

  • +86 187-2199-2033

Get a Free Demo