- Product
- HS Code
- Company
Electrical, electronic equipment(14.62%, $463.36 Billion)
Machinery, nuclear reactors, boilers(14.49%, $459.2 Billion)
Vehicles other than railway, tramway(12.03%, $381.04 Million)
Mineral fuels, oils, distillation products(8.41%, $266.59 Million)
Pharmaceutical products(5.61%, $177.85 Million)
Commodities not specified according to kind(3.94%, $124.98 Million)
Optical, photo, technical, medical apparatus(3.73%, $118.32 Million)
Pearls, precious stones, metals, coins(2.7%, $85.49 Million)
Plastics(2.28%, $72.35 Million)
Furniture, lighting signs, prefabricated buildings(2.18%, $69.01 Million)


These top 10 imports account for 70.01% of the total U.S. imports in 2024. For businesses and market analysts, the charts that follow provide a deeper understanding, showing the monetary value and market dynamics of the top 10 U.S. imports in 2024.
Tendata provides a complete list of HS codes, allowing you to understand which specific products are popular imports in the United States. The following uses "vehicles" as an example to show you Tendata's HS code report:

-
Origin
55 -
Destination
64 -
Customers
12,017 -
Competitors
16,554 -
Trades
291,762 -
Quantity
6,188,345,596.54 -
Weight(KG)
10,946,676,469.43 -
Total Price(USD)
3,251,115,876.15 -
Avg.Unit Qty Price(USD)
2.21 -
Avg.Unit Wgt Price(USD)
0.39
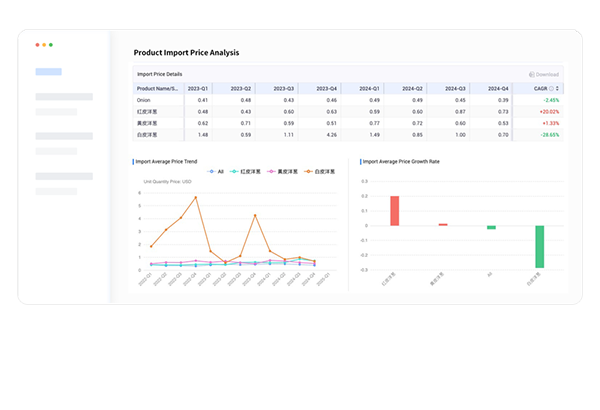
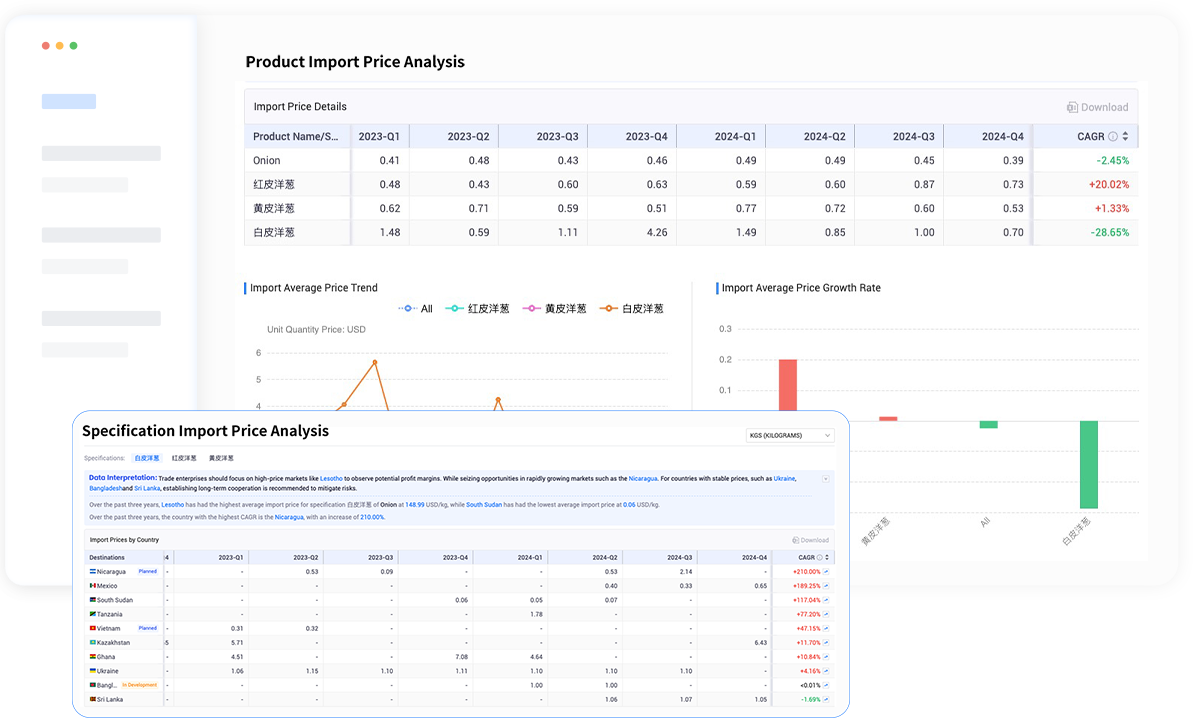
Average Import/Export Price
Average Price Trend
Average Price Growth Rate