
 Tendata AI
  Exhibition
 B2B Platforms
 Standalone Website
 Social Media
 Emails
 Import News
 2025-10-05
In 2024, the total value of Poland import activities reached US$379.5 billion, covering a wide range of goods sourced globally.
This figure reflects a 49% surge compared to the $254.7 billion import bill recorded five years earlier in 2020. On a yearly basis, however, the growth pace slowed, with Poland import data showing a modest 2.2% increase over the $371.4 billion registered in 2023.
Exchange rate shifts also influenced import dynamics. In 2024, the Polish złoty strengthened by 5.5% against the US dollar, making products purchased in dollars slightly more affordable when converted into local currency. Meanwhile, domestic inflation cooled significantly, averaging 3.861% in 2024, a sharp drop from 11.426% in 2023.

Poland's Leading Sources of Imports
The latest trade statistics reveal that 65.7% of Poland import goods were supplied by major trading partners.
1..Germany: 19.2%
2.Mainland China: 14.5%
3.United States: 5%
4.Italy: 4.7%
5.Netherlands: 3.9%
6.France: 3.5%
7.Czech Republic: 3.2%
8.South Korea: 2.9%
9.Saudi Arabia: 2.25%
10.Spain: 2.24%
11.Norway: 2.2%
12.Belgium: 2.17%
From a continental viewpoint, Poland's import profile shows:
·Europe: 60.1%
·Asia: 31.2%
·North America: 5.6%
·Latin America: 1.8%
·Africa: 1.2%
·Oceania: 0.1% (mainly Australia and New Zealand)
As an EU member since May 1, 2004, Poland continues to rely heavily on fellow EU nations, which accounted for 52.1% of total Poland imports in 2024.
Given the country's 36.6 million population, imports of $379.5 billion translate into an average $10,400 per person, an improvement over the $9,800 per capita seen in 2023.
Poland's Top 10 Imported Products
The following categories dominated Poland import activity in 2024:
1.Machinery including computers: $46.8B (12.3%)
2.Electrical machinery, equipment: $45.4B (12%)
3.Vehicles: $40B (10.5%)
4.Mineral fuels including oil: $28.8B (7.6%)
5.Plastics, plastic articles: $19.3B (5.1%)
6.Pharmaceuticals: $14.3B (3.8%)
7.Iron, steel: $12.2B (3.2%)
8.Optical, technical, medical apparatus: $8.5B (2.2%)
9.Clothing & accessories (non-knit): $8.3B (2.2%)
10.Articles of iron or steel: $8B (2.1%)
Together, these top 10 Poland imports represented 61% of the country's total foreign purchases.
·Biggest riser: Pharmaceuticals (+26%)
·Clothing & accessories: +20.5%
·Vehicles: +10.2%
·Decliners: Mineral fuels (-12.8%) and iron & steel (-8.3%)
At the 4-digit HS code level, Poland's leading import items included:
1.Cars (5% of total imports)
2.Crude oil (4%)
3.Auto parts (3.2%)
4.Processed petroleum oils (2.3%)
5.Medication mixes (2.1%)
6.Smartphones (1.9%)
7.Computers & readers (1.5%)
8.Blood fractions & antisera (1.4%)
9.Turbo-jets (1.2%)
10.Integrated circuits (0.9%)
Combined, these accounted for 23.6% of all Poland import goods.
Poland Import Companies
For firms eyeing the Poland import market, finding reliable buyers is essential. Using platforms like Tendata, companies can identify verified clients, track demand trends, and access decision-makers, cutting down the time for market expansion.
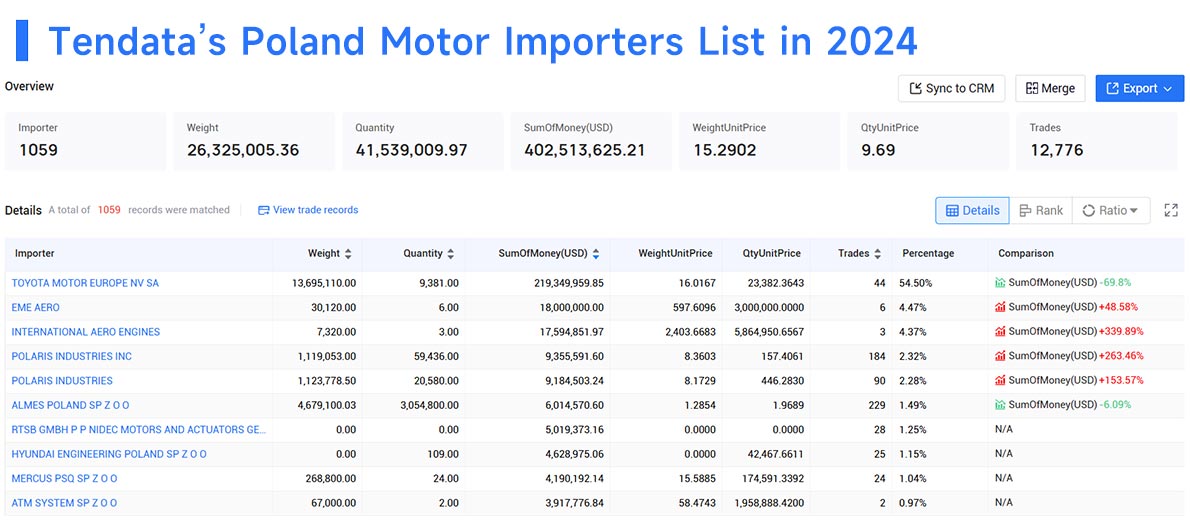
For example, Tendata's trade data highlights the top 10 Poland import buyers in 2024:
1.Toyota Motor Europe NV SA (54.5%, $219.35M)
2.EME Aero (4.47%, $18M)
3.International Aero Engines (4.37%, $17.59M)
4.Polaris Industries Inc (2.32%, $9.36M)
5.Polaris Industries (2.28%, $9.18M)
6.Almes Poland Sp z o o (1.49%, $6.01M)
7.RTSB GmbH P P Nidec Motors and Actuators Germany GmbH (1.25%, $5.02M)
8.Hyundai Engineering Poland Sp z o o (1.15%, $4.63M)
9.Mercus PSQ Sp z o o (1.04%, $4.19M)
10.ATM System Sp z o o (0.97%, $3.92M)
Final Thought
Whether you are a newcomer or an established trader, leveraging Poland import data provides valuable insights into purchasing trends, trade flows, and market opportunities. For more detailed statistics, companies can request a free Tendata demo.
Category
Leave Message for Demo Request or Questions



















