Tendata AI
  Exhibition
 B2B Platforms
 Standalone Website
 Social Media
 Emails
 Import News
 2026-07-10
Vietnam imported approximately US$448.2 billion worth of goods from international suppliers in 2025, marking a 35.5% increase compared with US$330.8 billion in 2021.
On a year-over-year basis, Vietnam's import spending increased by 18.2% from US$379.1 billion in 2024, reflecting strong demand for industrial inputs, technology products, and consumer goods.
Based on average currency exchange rates in 2025, the Vietnamese dong strengthened by 3.7% against the US dollar compared with 2024. The stronger local currency made imported products priced in US dollars relatively more affordable for Vietnamese buyers.
Vietnam recorded an average consumer inflation rate of 3.949% in 2025, compared with 3.624% in 2024.

Main Countries Supplying Vietnam's Imports
According to the latest available country-specific trade data, approximately 83% of Vietnam's imported goods were supplied by exporters from the following markets:
1. Mainland China — 34% of Vietnam's total imports
2. South Korea — 16.1%
3. Japan — 6.6%
4. Taiwan — 5.7%
5. United States — 4.2%
6. Thailand — 3.6%
7. Indonesia — 2.7%
8. Australia — 2.6%
9. Malaysia — 2.4%
10. India — 1.8%
11. Kuwait — 1.8%
12. Singapore — 1.4%
Asian countries remained Vietnam's dominant import partners, supplying 82.7% of total imports. European suppliers contributed another 6%, while North American exporters accounted for 4.8%.
Additional import sources included:
· Oceania (mainly Australia and New Zealand) — 2.9%
· Latin America and the Caribbean — 2.5%
· Africa — 1.2%
With a population of approximately 102.2 million people, Vietnam's total imports of US$448.2 billion in 2025 equal around US$4,400 per person in annual import demand, exceeding the US$3,750 per capita level recorded in 2024.
Vietnam's Top 10 Imported Products
The following product categories represented Vietnam's largest import expenditures in 2025. Each category's percentage share of total imports is also shown:
1. Electrical machinery and equipment — US$184.8 billion (41.2% of total imports)
2. Machinery including computers — US$45.3 billion (10.1%)
3. Plastics and plastic articles — US$20.7 billion (4.6%)
4. Mineral fuels including oil — US$15.1 billion (3.4%)
5. Iron and steel — US$13.1 billion (2.9%)
6. Vehicles — US$10.7 billion (2.4%)
7. Optical, technical and medical equipment — US$9.2 billion (2.1%)
8. Knitted or crocheted fabrics — US$7.3 billion (1.6%)
9. Copper — US$5.77 billion (1.3%)
10. Articles made from iron or steel — US$5.75 billion (1.3%)
Together, Vietnam's top 10 import categories represented 70.9% of the country's total import value in 2025, showing a strong concentration in industrial materials, machinery, and technology-related products.
Fastest-Growing Import Categories in Vietnam
Among Vietnam's major import categories, several sectors recorded strong year-over-year growth between 2024 and 2025.
The fastest-growing categories were:
· Machinery including computers — increased 59.2%
· Vehicles — increased 48.7%
· Electrical machinery and equipment — increased 35.8%
· Optical, technical and medical equipment — increased 22.8%
· Meanwhile, some import categories experienced declines:
· Mineral fuels including oil — decreased 45.2%
· Articles of iron or steel — decreased 11.7%
· Iron and steel products — decreased 11.6%
The statistics above are calculated at the 2-digit Harmonized Tariff System (HTS) code level. More detailed analysis can be conducted using 4-digit HS code classifications.
Vietnam Importers Database
Discover reliable sourcing and business opportunities through Vietnam's extensive importer database, powered by real Vietnam shipment records. With solutions such as Tendata's Global Importers & Exporters Finder, businesses can search, evaluate, and connect with verified Vietnamese buyers across different industries.
Vietnam Importers Directory
Tendata provides access to thousands of verified Vietnam importers with detailed shipment information, import volumes, product details, and supply chain insights.
Each company profile includes important information such as: Company name, Business location, Product keywords, HS codes, Import shipment history, Trade relationships
These insights help global suppliers identify qualified buyers, improve market targeting, and develop more effective international sales strategies.
Top Motorcycle Importers in Vietnam
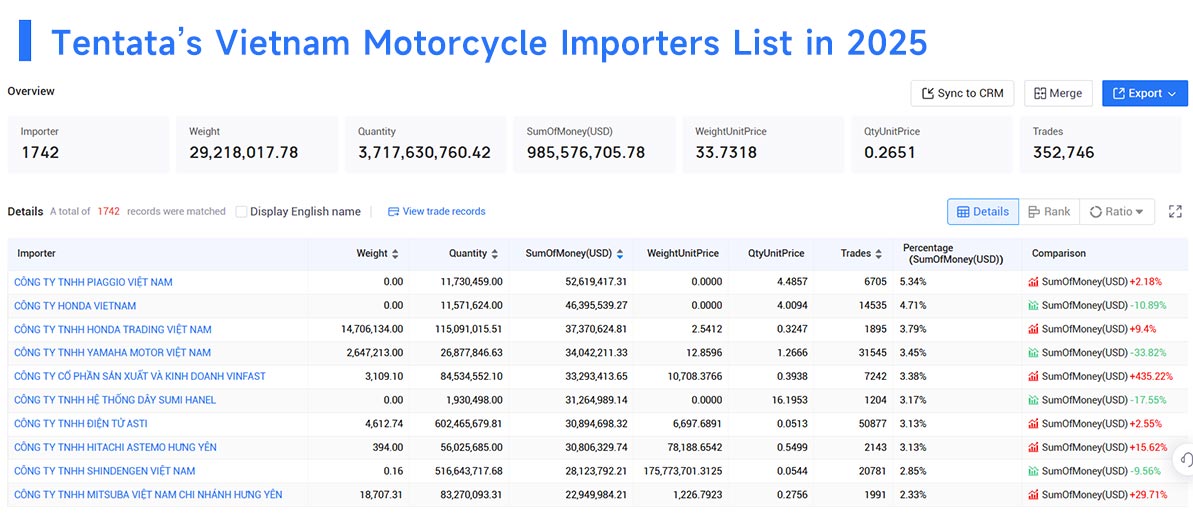
Taking motorcycles as an example, Tendata data shows that the following companies were among the leading motorcycle importers in Vietnam during 2025:
1. CÔNG TY TNHH PIAGGIO VIỆT NAM — 5.34% (US$52.62 million)
2. CÔNG TY HONDA VIETNAM — 4.71% (US$46.4 million)
3. CÔNG TY TNHH HONDA TRADING VIỆT NAM — 3.79% (US$37.37 million)
4. CÔNG TY TNHH YAMAHA MOTOR VIỆT NAM — 3.45% (US$34.04 million)
5. CÔNG TY CỔ PHẦN SẢN XUẤT VÀ KINH DOANH VINFAST — 3.38% (US$33.29 million)
6. CÔNG TY TNHH HỆ THỐNG DÂY SUMI HANEL — 3.17% (US$31.26 million)
7. CÔNG TY TNHH ĐIỆN TỬ ASTI — 3.13% (US$30.89 million)
8. CÔNG TY TNHH HITACHI ASTEMO HƯNG YÊN — 3.13% (US$30.81 million)
9. CÔNG TY TNHH SHINDENGEN VIỆT NAM — 2.85% (US$28.12 million)
10. CÔNG TY TNHH MITSUBA VIỆT NAM CHI NHÁNH HƯNG YÊN — 2.33% (US$22.95 million)
>>Find More Vietnam Importers via Tendata<<
With Tendata's verified Vietnam import data, companies can analyze buyer behavior, identify active importers, track purchasing trends, and discover valuable business opportunities in the Vietnamese market.
Category
Leave Message for Demo Request or Questions