Tendata AI
  Exhibition
 B2B Platforms
 Standalone Website
 Social Media
 Emails
 Import News
 2026-07-13
Located along the eastern coast of Africa and straddling the Equator, the Republic of Kenya imported goods valued at approximately US$21.7 billion in 2025.
Compared with 2021, when total imports reached US$19.3 billion, Kenya's import spending increased by 12.6% over the five-year period.
On a year-over-year basis, imports grew 7.5%, rising from US$20.2 billion in 2024 to US$21.7 billion in 2025.
Based on the average exchange rate for 2025, the Kenyan shilling weakened by 3.8% against the US dollar compared with the previous year. As a result, imported goods priced in US dollars became relatively more expensive for Kenyan buyers.

Kenya's Major Import Partners
The latest available trade statistics indicate that 74.2% of Kenya's imports originated from the following countries:
1. Mainland China (23.9%)
2. United Arab Emirates (11.5%)
3. India (10.4%)
4. Malaysia (5.1%)
5. Japan (5%)
6. United States (4.9%)
7. Saudi Arabia (3.5%)
8. South Africa (2.3%)
9. Oman (2.2%)
10. Germany (1.9%)
11. Tanzania (1.8%)
12. Egypt (1.7%)
From a regional perspective, Asia supplied the majority of Kenya's imported goods, accounting for 70.1% of total import value. European countries contributed 11.9%, while neighboring African economies provided another 10%.
Smaller shares came from North America (5.7%), Latin America and the Caribbean (1.4%), and Oceania (0.9%), mainly Australia and New Zealand.
With an estimated population of 53.4 million, Kenya's 2025 imports translated into roughly US$410 worth of imported goods per resident, compared with approximately US$385 per person in 2024.
Kenya's average consumer inflation rate eased slightly to 4.063% in 2025, down from 4.496% a year earlier.
Kenya's Top 10 Import Categories
At the 2-digit Harmonized System (HS) level, the following product groups represented Kenya's largest import categories in 2025.
1. Mineral fuels and petroleum products: US$4.6 billion (21.2%)
2. Machinery, including computers: US$2.2 billion (10.2%)
3. Vehicles: US$1.43 billion (6.6%)
4. Electrical machinery and equipment: US$1.27 billion (5.8%)
5. Cereals: US$1.2 billion (5.5%)
6. Animal or vegetable fats, oils and waxes: US$1.12 billion (5.2%)
7. Iron and steel: US$1.1 billion (5%)
8. Plastics and plastic products: US$959.8 million (4.4%)
9. Pharmaceuticals: US$595.4 million (2.7%)
10. Miscellaneous chemical products: US$500.5 million (2.3%)
Together, these 10 product groups represented approximately 69% of Kenya's total import value in 2025.
Among the leading import categories, machinery and computers recorded the strongest annual growth, increasing 39.4% compared with 2024.
Other notable gains included iron and steel (+38.5%), vehicles (+18.9%), and animal or vegetable fats, oils and waxes (+14.7%).
Meanwhile, pharmaceutical imports declined 15.6% year over year, while mineral fuels and petroleum products decreased 3.4%.
Kenya's Leading Imported Products (4-Digit HS Level)
Using the more detailed 4-digit Harmonized Tariff System (HTS) classification, Kenya's highest-value imported products in 2025 included:
· Processed petroleum oils (18.2%)
· Palm oil (4.8%)
· Wheat (2.8%)
· Hot-rolled iron or non-alloy steel products (2.6%)
· Passenger cars (2.6%)
· Rice (2%)
· Packaged medicaments (1.9%)
· Sugar (1.5%)
· Petroleum gases (1.3%)
· Mixed fertilizers (1.1%)
Combined, these ten products accounted for 38.9% of Kenya's total import expenditure.
Kenya Importers Database
Find reliable buyers through Tendata's Kenya Importers Database, which is built using verified Kenya customs shipment records. With Tendata Global Importers & Exporters Finder, exporters can identify active importers, evaluate purchasing activity, and establish direct business connections with qualified buyers in Kenya.
Kenya Importers Directory
Tendata provides comprehensive profiles of verified Kenya importers, including shipment history, purchasing volume, supply chain relationships, product information, and company contact details. These insights help exporters locate trustworthy buyers and make data-driven market decisions.
Based on verified Kenya import data, Tendata delivers real-time intelligence covering trade records, product specifications, supplier relationships, and buyer contact information across multiple industries.
List of Kenya Importers
The Tendata platform includes thousands of active Kenyan importers. Every company profile contains valuable business information such as company name, location, imported products, HS codes, and shipment history, making it easier for exporters to identify suitable customers and expand into the Kenyan market.
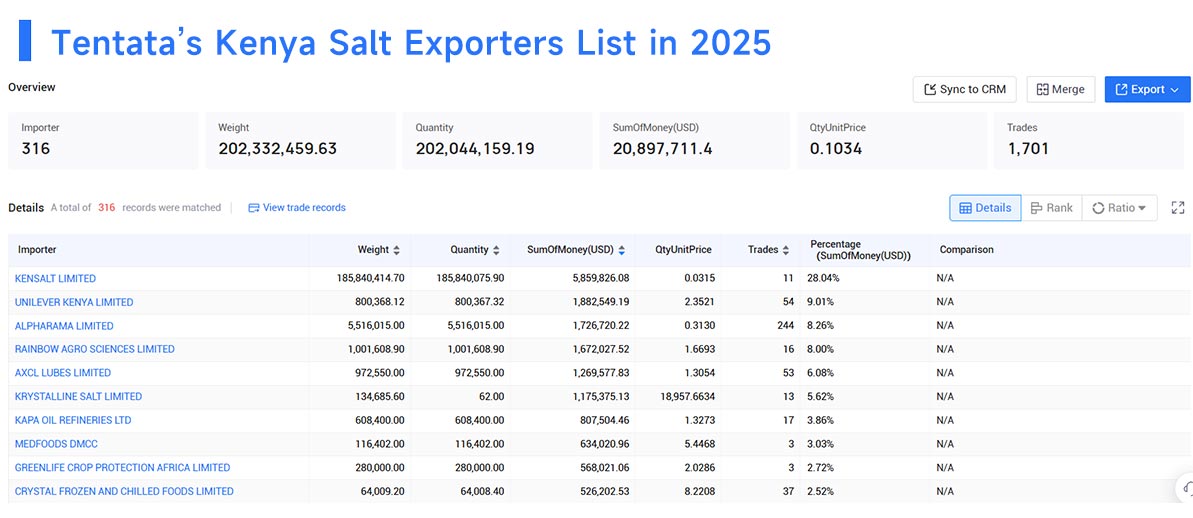
Using salt imports as an example, Tendata identifies the following as some of Kenya's leading importers in 2025:
1. KENSALT LIMITED (28.04%, US$5.86 Million)
2. UNILEVER KENYA LIMITED (9.01%, US$1.88 Million)
3. ALPHARAMA LIMITED (8.26%, US$1.73 Million)
4. RAINBOW AGRO SCIENCES LIMITED (8%, US$1.67 Million)
5. AXCL LUBES LIMITED (6.08%, US$1.27 Million)
6. KRYSTALLINE SALT LIMITED (5.62%, US$1.18 Million)
7. KAPA OIL REFINERIES LTD (3.86%, US$0.81 Million)
8. MEDFOODS DMCC (3.03%, US$0.63 Million)
9. GREENLIFE CROP PROTECTION AFRICA LIMITED (2.72%, US$0.57 Million)
10. CRYSTAL FROZEN AND CHILLED FOODS LIMITED (2.52%, US$0.53 Million)
Category
Leave Message for Demo Request or Questions