
 Tendata AI
  Exhibition
 B2B Platforms
 Standalone Website
 Social Media
 Emails
 Import News
 2025-10-10
In 2024, Finland's import value reached approximately US$80.4 billion, representing a 17.8% increase compared to $68.3 billion in 2020.
However, year over year, Finland's import activity showed a -3.2% decrease from $83.1 billion in 2023, reflecting a slight cooling in demand across several sectors.
Based on the average exchange rate for 2024, Finland, which uses the euro, saw a marginal 0.02% appreciation against the US dollar from 2023 to 2024. This made Finland's imports slightly less expensive when converted from euros, helping maintain competitiveness in international trade.

Finland's Main Import Partners
The latest country-specific data reveals that 69.2% of Finland's import transactions originated from 12 primary supplier nations. Leading the list were:
1.Germany (13.2%)
2.Sweden (11.5%)
3.Mainland China (9.9%)
4.Norway (7.4%)
5.United States (5%)
6.Netherlands (4.8%)
7.Poland (3.4%)
8.Estonia (3.1%)
9.Italy (3%)
10.France (2.9%)
11..United Kingdom (2.6%)
12.Denmark (2.5%)
From a continental standpoint, Finland's import value was dominated by European countries (71.2%), followed by Asia (19%) and North America (6.5%).
As a long-time EU member, Finland's import share from other European Union nations reached 58.1% in 2024, down from 70.3% in 2023, suggesting a slight diversification of sourcing markets.
Smaller shares came from Latin America (2.1%), Oceania (0.7%), and Africa (0.6%).
Given Finland's population of 5.6 million, the total Finland's import value translates to about $14,400 per person in 2024 — a small dip compared with $14,750 in 2023.
Finland's Top 10 Imports
The following product groups account for the highest Finland's import expenditures during 2024, along with their share of total import value:
1.Mineral fuels including oil: US$11.1 billion (13.8%)
2.Machinery including computers: $10.2 billion (12.7%)
3.Electrical machinery and equipment: $9.2 billion (11.4%)
4.Vehicles: $7.2 billion (8.9%)
5.Ores, slag, and ash: $2.9 billion (3.6%)
6.Iron and steel: $2.7 billion (3.3%)
7.Plastics and plastic goods: $2.64 billion (3.3%)
8.Pharmaceuticals: $2.64 billion (3.3%)
9.Optical, technical, and medical instruments: $2.4 billion (3%)
10.Articles of iron or steel: $2.3 billion (2.8%)
Together, these categories represented about 66.3% of Finland's total imports in 2024.
Fastest-Growing and Declining Import Segments
Between 2023 and 2024, Finland's import structure changed notably. The fastest-growing categories were:
·Ores, slag, and ash (up 10.6%)
·Pharmaceuticals (up 2.5%)
·Plastics and related items (up 0.1%)
Meanwhile, the largest drops occurred in iron and steel (-9.6%) and vehicles (-9.3%), reflecting lower industrial demand.
On a more detailed level, Finland's import data shows leading goods such as:
1.Crude oil (6.8%)
2.Cars (5%)
3.Processed petroleum oils (4.1%)
4.Medicinal mixes (2.3%)
5.Computers and optical readers (2.2%)
6.Smartphones and mobile devices (2.1%)
7.Electric batteries (1.8%)
8.Auto parts (1.7%)
9.Petroleum gases (1.4%)
10.Copper ores and concentrates (1.3%)
Finding Buyers and Opportunities in Finland
For global companies seeking to expand into Finland's import market, finding reliable Finnish buyers is crucial. Using Tendata's intelligent trade tools, businesses can access verified importer databases, analyze purchasing trends, and obtain contact information, accelerating entry into the Finnish market.
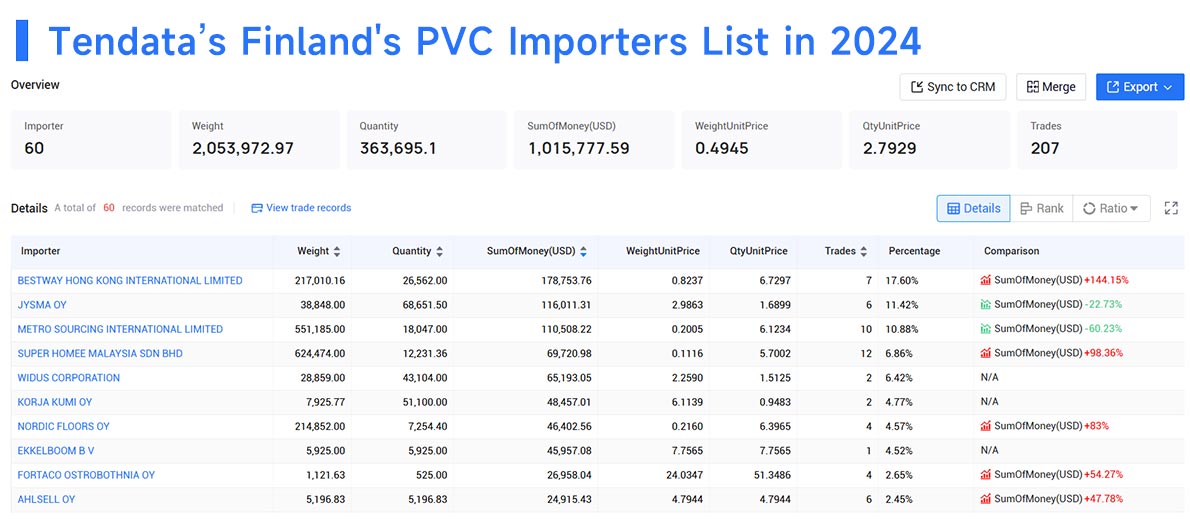
For instance, when exploring PVC-related demand, Tendata's Finland import database reveals the Top 10 Buyers for 2024:
1.BESTWAY HONG KONG INTERNATIONAL LIMITED (17.6%, $0.18M)
2.JYSMA OY (11.42%, $0.12M)
3.METRO SOURCING INTERNATIONAL LIMITED (10.88%, $0.11M)
4.SUPER HOMEE MALAYSIA SDN BHD (6.86%, $0.07M)
5.WIDUS CORPORATION (6.42%, $0.07M)
6.KORJA KUMI OY (4.77%, $0.05M)
7.NORDIC FLOORS OY (4.57%, $0.05M)
8.EKKELBOOM B.V. (4.52%, $0.05M)
9.FORTACO OSTROBOTHNIA OY (2.65%, $0.03M)
10.AHLSELL OY (2.45%, $0.02M)
Whether you are a seasoned exporter or a new market entrant, using Finland's import statistics and verified trade data from Tendata can uncover high-value business opportunities.
For comprehensive insights into Finland's import performance or detailed trade intelligence, contact Tendata today for a free online demo.
Category
Leave Message for Demo Request or Questions



















