
 Tendata AI
  Exhibition
 B2B Platforms
 Standalone Website
 Social Media
 Emails
 Import News
 2025-12-22
Tendata provides import and export data for 228 countries and regions worldwide, including Lithuania Import Data. Utilizing the latest Lithuania Import Data is an indispensable tool for searching new clients, conducting customer background checks, researching purchasing habits, performing comprehensive market research, or analyzing competitors!
Want to instantly access a list of 10,000 potential international clients with their contact details?
Want to boost your customer development efficiency by 200%?
Check out Tendata's free demo of Lithuania Import Data now to see how it can help you!

(1)Who are the major importers of Lithuanian products in 2024?
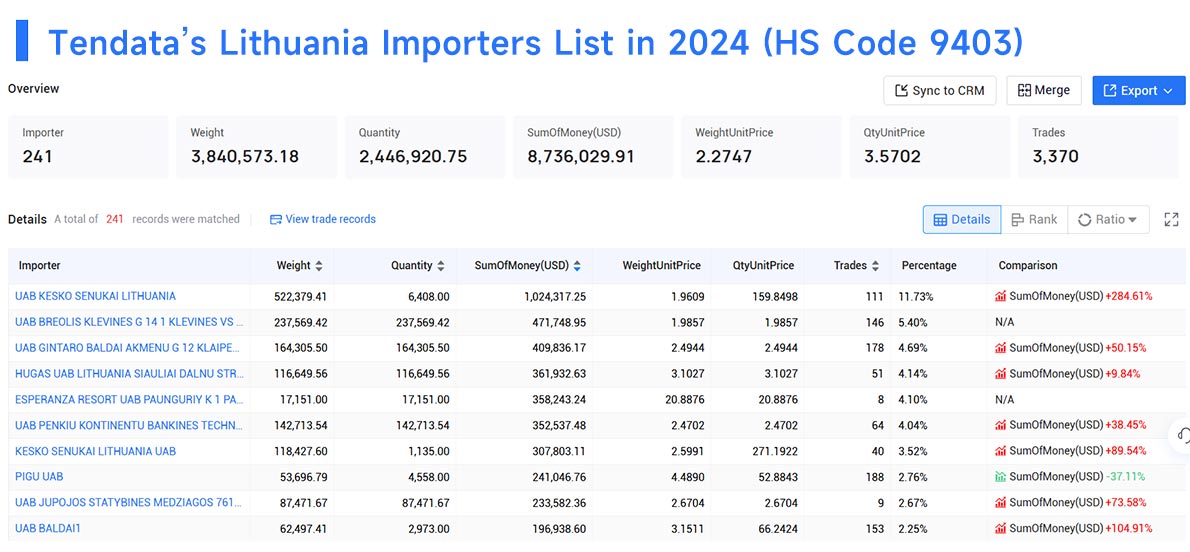
Using product names or HS codes, you can obtain buyer lists for your target products on Tendata. Moreover, you can access detailed procurement records for specific companies—including suppliers, purchase prices, timing, and quantities. Below is an example using HS code 9403 to showcase major importers found on Tendata:
1.UAB KESKO SENUKAI LITHUANIA(11.73%, $1.02 Million)
2.UAB BREOLIS KLEVINES G 14 1 KLEVINES VS AVIZIENIU SEN VILNIAUS R SAV ЛИТВА(5.4%, $0.47 Million)
3.UAB GINTARO BALDAI AKMENU G 12 KLAIPEDA LT 92347 LITHUANIA(4.69%, $0.41 Million)
4.HUGAS UAB LITHUANIA SIAULIAI DALNU STR 50 45(4.14%, $0.36 Million)
5.ESPERANZA RESORT UAB PAUNGURIY K 1 PAUNGURIY K LT 21282 TRAKY R LITHUANIA(4.1%, $0.36 Million)
6.UAB PENKIU KONTINENTU BANKINES TECHNOLOGIJOS ВУЛ КАРЕЙВЮ 2 LT 08248 М ВІЛЬНЮС ЛИТОВСЬКА РЕСПУБЛІКА(4.04%, $0.35 Million)
7.KESKO SENUKAI LITHUANIA UAB(3.52%, $0.31 Million)
8.PIGU UAB(2.76%, $0.24 Million)
9.UAB JUPOJOS STATYBINES MEDZIAGOS 76178 SODO STR 26 SIAULIAI CITYLITHUANIA(2.67%, $0.23 Million)
10.UAB BALDAI1(2.25%, $0.2 Million)
>>Want to develop customers using Tendata? Click here
(2)What are Lithuania's main import products in 2024?
According to Lithuania Import Data provided by Tendata, here are the top ten products imported by Lithuania in 2024:
1. Mineral fuels, oils, distillation products(18.02%, $8.07 Billion)
2. Vehicles other than railway, tramway(10.54%, $4.72 Billion)
3. Electrical, electronic equipment(9.24%, $4.14 Billion)
4. Machinery, nuclear reactors, boilers(8.3%, $3.72 Billion)
5. Plastics(4.42%, $1.98 Billion)
6. Pharmaceutical products(4.31%, $1.93 Billion)
7. Iron and steel(2.32%, $1.04 Billion)
8. Articles of iron or steel(2.32%, $1.04 Billion)
9. Organic chemicals(2.19%, $983.08 Million)
10. Optical, photo, technical, medical apparatus(2.05%, $917.35 Million)
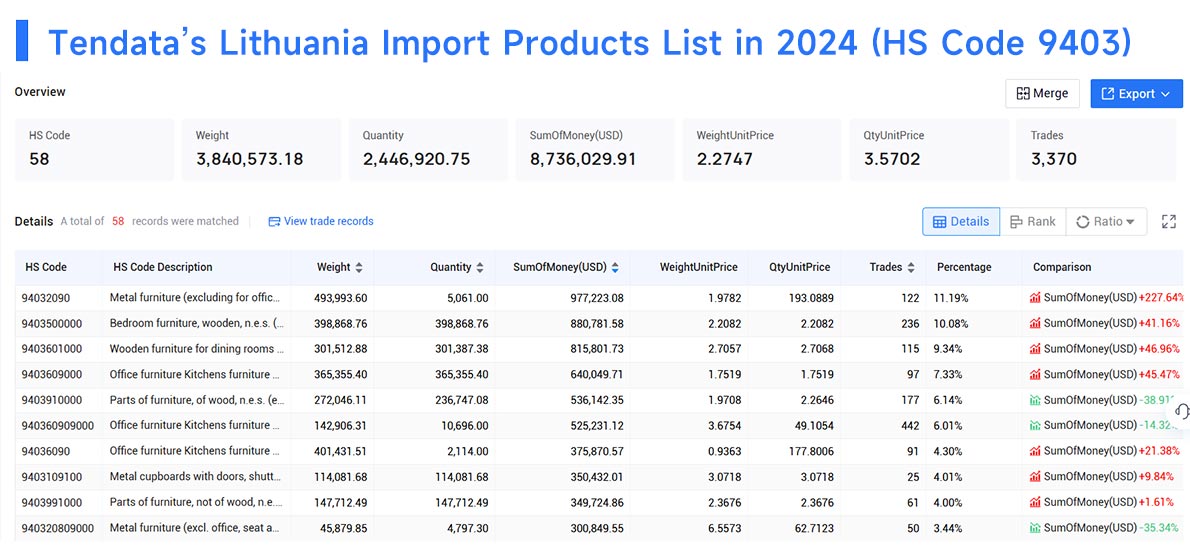
Tendata can help you gain detailed insights into Lithuania's imported products through Lithuania Import Data. Our diverse reports are designed to save you time and are extremely user-friendly. For example, using HS code 9403 as an illustration, we show you the primary product categories Lithuania imports and their corresponding HS code list:
1.HS Code:94032090(11.19%, $0.98 Million):Metal furniture (excluding for offices, seats and medical, surgical, dental or veterinary furniture); others
2.HS Code:9403500000(10.08%, $0.88 Million):Bedroom furniture, wooden, n.e.s. (excl. seats)
3.HS Code:9403601000(9.34%, $0.82 Million):Wooden furniture for dining rooms and living rooms (excluding chairs)
4.HS Code:9403609000(7.33%, $0.64 Million):Office furniture Kitchens furniture Bedrooms furniture Seats
5.HS Code:9403910000(6.14%, $0.54 Million):Parts of furniture, of wood, n.e.s. (excluding parts of seats or medical, surgical, dental or veterinary furniture)
6.HS Code:940360909000(6.01%, $0.53 Million):Office furniture Kitchens furniture Bedrooms furniture Seats
7.HS Code:94036090(4.3%, $0.38 Million):Office furniture Kitchens furniture Bedrooms furniture Seats
8.HS Code:9403109100(4.01%, $0.35 Million):Metal cupboards with doors, shutters or flaps, for offices, of a weight or volume of > 80 cm in height
9.HS Code:9403991000(4%, $0.35 Million):Parts of furniture, not of wood, n.e.s. (excl. of seats or medical, surgical, dental or veterinary furniture)
10.HS Code:940320809000(3.44%, $0.3 Million):Metal furniture (excl. office, seat and medical, surgical, dental or veterinary furniture)
>>Want to use Tendata for product research? Click here
(3)Which countries did Lithuania import from most in 2024?
Below is the list of Lithuania's top ten import partners and their import values:
1. Poland(14.24%, $6.27 Billion)
2. Germany(12.68%, $5.58 Billion)
3. Latvia(8.34%, $3.67 Billion)
4. Norway(5.38%, $2.37 Billion)
5. Saudi Arabia(5.16%, $2.27 Billion)
6. Netherlands(5.11%, $2.25 Billion)
7. China(4.63%, $2.04 Billion)
8. Sweden(4.23%, $1.86 Billion)
9. United States(3.95%, $1.74 Billion)
10. Estonia(3.93%, $1.73 Billion)
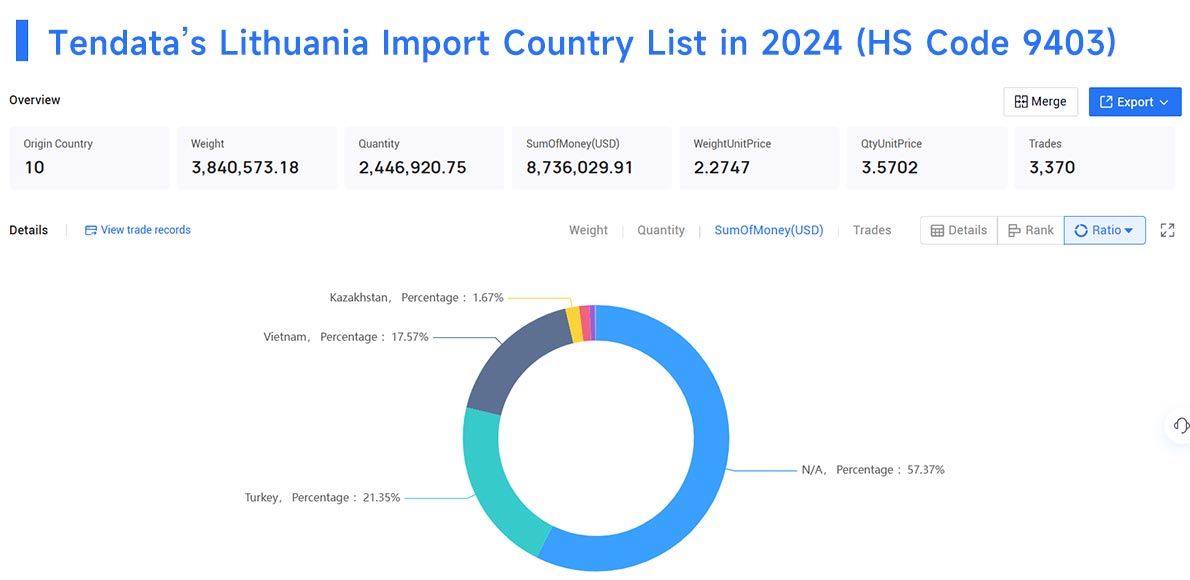
These are Lithuania's key import markets. Looking to analyze trade partners for specific Lithuanian products? Visit Tendata to effortlessly explore global markets. For example, using HS code 9403, we show you the primary trading partner countries importing this product into Lithuania:
1.Turkey(21.35%, $1.87 Million)
2.Vietnam(17.57%, $1.53 Million)
3.Kazakhstan(1.67%, $0.15 Million)
4.Indonesia(1.25%, $0.11 Million)
5.Russia(0.68%, $0.06 Million)
>>Learn more about Lithuania Import Data available from Tendata
Why Choose Tendata Global Trade Data?
Tendata connects over 10 billion trade records across 228 countries and regions. With one-click search, access in-depth data on over 500 million global enterprises—all verified buyers with authentic purchase records and intent. Tendata also provides contact details for over 850 million business executives, enabling you to quickly connect with high-quality client groups and save significant time.
If you are a marketer or trader seeking to import more cost-effective products, contact us immediately to access global trade data. Please visit our website at tendata.com or send an email to [email protected] for more information.
Category
Leave Message for Demo Request or Questions



















