
 Tendata AI
  Exhibition
 B2B Platforms
 Standalone Website
 Social Media
 Emails
 Import News
 2026-02-24
In 2025, Brazil's imports totaled approximately US$280.4 billion, reflecting the country's strong demand for foreign goods across multiple industries.
Compared with 2021, when imports stood at $219.4 billion, the latest figure represents a substantial 27.8% increase over five years. On a year-over-year basis, Brazil's imports expanded by 6.7%, rising from $262.9 billion in 2024 to $280.4 billion in 2025.
Exchange rate movements also played a role in shaping Brazil's imports. Based on the average rate for 2025, the Brazilian real weakened by about 4% against the US dollar compared to 2024. A softer local currency meant that goods priced in US dollars became more expensive when converted into Brazilian real, increasing overall import costs.
Meanwhile, domestic inflation climbed to 5.307% in 2025, up from 4.367% the year before. Rising inflation, combined with currency depreciation, further influenced the structure and pricing of Brazil's imports.
Brazil allocated the highest import spending to processed petroleum oils, turbo-jets, automobile parts and accessories, passenger vehicles, and packaged pharmaceutical products. Together, these five major categories accounted for roughly 17.8% of Brazil's total import expenditure in 2025.
With a population of about 213.4 million people, Brazil's imports in 2025 equate to approximately $1,300 in imported goods per person—higher than the $1,200 per capita recorded in 2024.

Major Suppliers Supporting Brazil's Imports
Country-level data indicates that 70.8% of Brazil's imports originated from the following key trade partners:
1. China (25.3%)
2. United States (16.4%)
3. Germany (5.1%)
4. Argentina (4.6%)
5. Russia (3.4%)
6. India (3%)
7. France (2.57%)
8. Italy (2.52%)
9. Mexico (2.22%)
10. Japan (2.16%)
11. South Korea (1.9%)
12. Chile (1.7%)
From a regional perspective, 42% of Brazil's imports by value came from Asian suppliers. European countries contributed 24.2%, while North American exporters supplied 19.7%. Latin American nations and Caribbean partners (excluding Mexico) represented 10.8%.
Smaller shares were sourced from Africa (2.9%) and Oceania (0.4%), primarily led by Australia and New Zealand.
Brazil's Top 10 Import Categories
The following product groups generated the highest import values in 2025 and represent the backbone of Brazil's imports:
1. Machinery including computers – US$47.1 billion (16.8%)
2. Mineral fuels including oil – $30.6 billion (10.9%)
3. Electrical machinery and equipment – $30.1 billion (10.8%)
4. Vehicles – $23.1 billion (8.2%)
5. Fertilizers – $15.5 billion (5.5%)
6. Organic chemicals – $15 billion (5.3%)
7. Pharmaceuticals – $14.5 billion (5.2%)
8. Plastics and plastic products – $11 billion (3.9%)
9. Optical, technical and medical apparatus – $9.6 billion (3.4%)
10. Other chemical products – $8.5 billion (3%)
Altogether, these ten product groups accounted for about 73.1% of Brazil's total import value in 2025.
Among them, the fastest-growing segments were pharmaceuticals (up 17.8%), machinery including computers (up 14.4%), and fertilizers (up 14.1%).
In contrast, spending declined in mineral fuels (down 10.7%), electrical machinery (down 2.8%), and plastics (down 0.2%) compared with 2024.
All figures above are calculated at the 2-digit Harmonized Tariff System (HTS) level, while deeper product analysis can be conducted at the 4-digit level for more detailed trade insights.
Finding Buyers in Brazil
For companies targeting opportunities within Brazil's imports market, locating dependable buyers is a critical first step. By leveraging Tendata's advanced tools—such as keyword search and HS code filters—businesses can efficiently identify verified Brazilian importers, analyze purchasing behavior, and obtain key contact information.
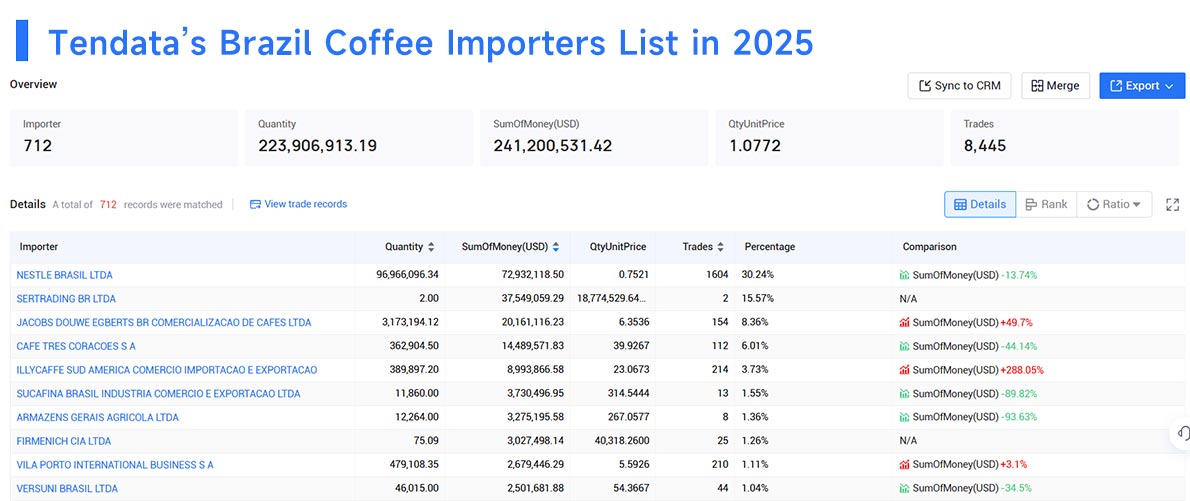
For example, when analyzing coffee-related demand, Tendata's system can instantly reveal the top 10 buyers in Brazil for 2025:
1. NESTLE BRASIL LTDA (30.24%)
2. SERTRADING BR LTDA (15.57%)
3. JACOBS DOUWE EGBERTS BR COMERCIALIZACAO DE CAFES LTDA (8.36%)
4. CAFE TRES CORACOES S A (6.01%)
5. ILLYCAFFE SUD AMERICA COMERCIO IMPORTACAO E EXPORTACAO (3.73%)
6. SUCAFINA BRASIL INDUSTRIA COMERCIO E EXPORTACAO LTDA (1.55%)
7. ARMAZENS GERAIS AGRICOLA LTDA (1.36%)
8. FIRMENICH CIA LTDA (1.26%)
9. VILA PORTO INTERNATIONAL BUSINESS S A (1.11%)
10. VERSUNI BRASIL LTDA (1.04%)
>>Get A Free Demo<<
Whether you are an experienced exporter or just entering the market, analyzing Brazil's imports data can uncover substantial trade opportunities. For more detailed Brazilian import statistics and buyer insights, contact Tendata to request a free online demo.
Category
Leave Message for Demo Request or Questions



















