
 Tendata AI
  Exhibition
 B2B Platforms
 Standalone Website
 Social Media
 Emails
 Import News
 2026-03-05
In 2025, Switzerland purchased goods worth US$505.7 billion from international suppliers.
Compared with 2021, when imports totaled $324.5 billion, this represents a sharp 55.8% increase over five years. On a year-over-year basis, Switzerland's import spending surged 36.8%, rising from $369.7 billion in 2024.
Based on the average 2025 exchange rate, the Swiss franc weakened by 5.6% against the US dollar compared to the previous year. As a result, imports priced in stronger US dollars became relatively more expensive when converted into Swiss francs.
Domestically, Switzerland recorded an average consumer inflation rate of just 0.229% in 2025, down from 1.06% in 2024.

Leading Suppliers to Switzerland
Recent country-level data indicates that 71.4% of Switzerland's imports originated from the following economies:
· Germany (15.2%)
· United States (13.4%)
· United Arab Emirates (9.5%)
· Italy (7.7%)
· Slovenia (6.1%)
· China (5.1%)
· France (4.9%)
· Austria (2.3%)
· United Kingdom (2.1%)
· Canada (1.9%)
· Japan (1.8%)
· Spain (1.5%)
From a regional standpoint, European countries supplied nearly 48% of Switzerland’s total import value in 2025. Asian partners accounted for 26.6%, while North American exporters provided 15.7%.
Although Switzerland is not a member of the European Union—maintaining a long-standing tradition of neutrality and sovereignty—EU member states still represented 45.4% of Switzerland’s overall import expenditure in 2025.
Smaller shares came from Africa (5.3%), Latin America (2.9%, excluding Mexico but including the Caribbean), and Oceania (1.4%), mainly driven by Australia and New Zealand.
With a population of about 9 million, Switzerland’s $505.7 billion import total translates into approximately $56,000 in annual imported goods demand per resident—well above the $41,600 per capita recorded in 2024.
Switzerland's Top 10 Import Categories (2025)
The following product groups generated the highest import values, along with their percentage share of total imports:
1. Gems and precious metals: US$234.1 billion (46.3%)
2. Pharmaceuticals: $79 billion (15.6%)
3. Machinery including computers: $23.5 billion (4.7%)
4. Vehicles: $20.2 billion (4%)
5. Electrical machinery and equipment: $18.1 billion (3.6%)
6. Mineral fuels including oil: $11.6 billion (2.3%)
7. Organic chemicals: $11 billion (2.2%)
8. Optical, technical and medical apparatus: $10.4 billion (2.1%)
9. Plastics and plastic articles: $8 billion (1.6%)
10. Furniture, bedding, lighting, signs and prefabricated buildings: $5.4 billion (1.1%)
Together, these top 10 categories accounted for 83.3% of Switzerland’s total import spending in 2025.
Among them, gems and precious metals recorded the fastest growth, rising 88.7% year over year, largely driven by increased trade in gold, platinum, and silver. Organic chemicals followed with a 36.1% increase, while pharmaceuticals expanded 16.4%.
The smallest rise was seen in mineral fuels including oil, which grew by 4.3% compared to 2024.
Note: The figures above are based on two-digit Harmonized Tariff System (HTS) classifications.
At the more detailed four-digit HTS level, Switzerland’s largest import expenditures were for unwrought gold (41.2% of total imports), medicaments in dosage form (11%), blood fractions including antisera (4.5%), passenger cars (2.7%), jewelry (2.1%), precious metal waste and scrap (1.1%), heterocyclic compounds and nucleic acids (1%), refined petroleum oils (0.9%), computers and optical readers (0.8%), and unwrought platinum (0.8%).
Finding Buyers in Switzerland
For businesses seeking to enter the Swiss import market, identifying dependable buyers is crucial. Tendata’s advanced tools—such as keyword searches and HS code filtering—allow companies to quickly locate verified customers, analyze procurement trends, and obtain contact details, significantly reducing the time needed to establish a presence.
For example, when analyzing wood-related demand, Tendata can instantly display the top 10 buyers in Switzerland for 2024:
1. CONFORAMA SUISSE SA (27.94%)
2. GLOBAL ECOMMERCE GMBH (9.33%)
3. H AND M HENNES AND MAURITZ GBC AB (7.2%)
4. FEDERATION OF MIGROS COOPERATIVES (6.73%)
5. CENTRE HARI OM TAT SAT (3.8%)
6. POPULART AG (3.44%)
7. FOUR SEASONS LES BERGUES (3%)
8. COOP NVZ LANGENTHAL (2.78%)
9. BRISOLE AG (2.48%)
10. CHANGEMAKER AG (1.55%)
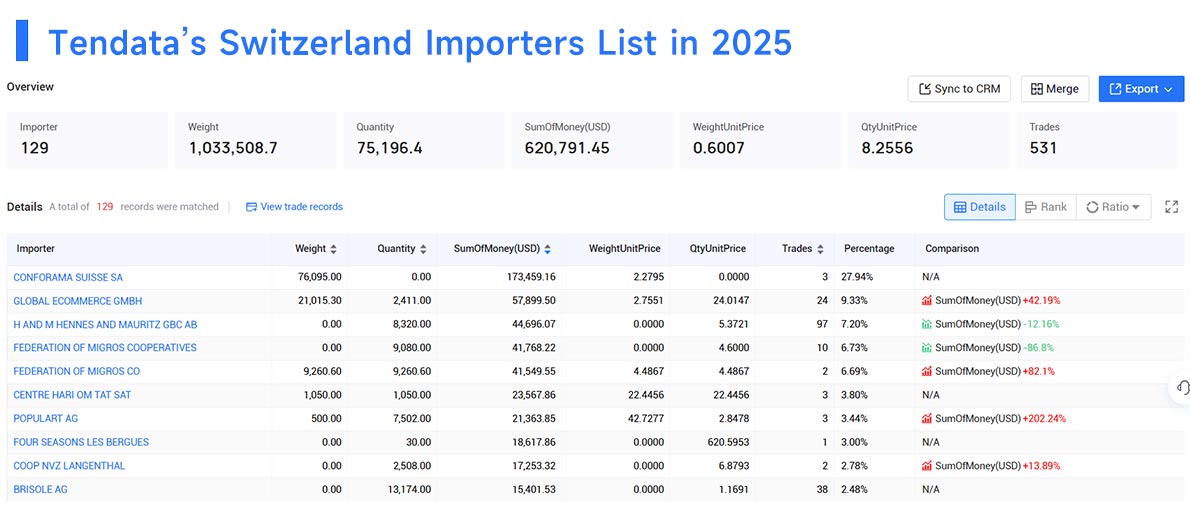
Whether you are an experienced exporter or new to international trade, using Swiss import data can reveal valuable business opportunities. For more details on Switzerland’s import statistics or to access comprehensive trade data, contact Tendata for a free online demonstration.
Category
Leave Message for Demo Request or Questions



















