
 Tendata AI
  Exhibition
 B2B Platforms
 Standalone Website
 Social Media
 Emails
 Import News
 2026-03-09
In 2025, the total value of France's Import purchases reached approximately US$776.8 billion. This figure represents a 9.7% increase compared with 2021, when the country imported goods worth about $707.8 billion.
Compared with the previous year, France's Import spending expanded by 4.9%, rising from $740.8 billion in 2024 to the 2025 level.
According to the average exchange rate for 2025, France uses the euro, which strengthened by 4.4% against the US dollar between 2024 and 2025. As a result, imports priced in US dollars became slightly cheaper for French buyers when converted into euros due to the stronger European currency.
On the domestic front, France's consumer inflation rate averaged 2.313% in 2025, a noticeable decline compared with the 5.662% average recorded in 2024.
Among the most valuable products within France's Import structure in 2025 were passenger cars, crude petroleum, packaged medicines, turbojet engines, and refined petroleum oils. Together, these five categories accounted for about 18% of France's total import expenditure during the year.
From a global standpoint, France's Import demand represented roughly 3.2% of total worldwide imports, which were estimated at $24.259 trillion in 2024. This share was slightly higher than the country's proportion recorded in the previous year.
Best Suppliers for France's Imported Products
The latest country-level statistics indicate that 70.8% of goods imported into France came from the following major suppliers: Germany (35.6% of France's total imports), mainland China (7.5%), the United States (5.2%), Italy (5.1%), Spain (4%), Belgium (2.8%), the Netherlands (2.7%), the United Kingdom (2.16%), Switzerland (2.16%), Poland (1.8%), Türkiye (1.7%), and the Czech Republic (1.3%).
When examined by region, European countries supplied about 60.3% of France's total imports in 2025, highlighting the importance of regional trade links. Asian partners contributed 23.3% of France's imported goods, while North American exporters accounted for 9.5%.
Furthermore, European Union member states captured 52.2% of France's import spending, slightly lower than the 53.3% share recorded in 2024.
Exports from African countries represented 5.2% of France's imports. Much smaller shares originated from Latin America (1.4%), excluding Mexico but including Caribbean nations, and Oceania (0.3%), mainly from Australia and New Zealand.
With a national population of approximately 68.6 million people, France's $776.8 billion import bill in 2025 translates to about $11,300 in imported goods per person annually. This per-capita demand is slightly higher than the $11,200 recorded in 2024.

France's Top 10 Imports
The product categories below generated the largest import values for France in 2025, along with their respective shares of total imports.
1.Machinery including computers: US$101.3 billion (13%)
2.Vehicles: $79.1 billion (10.2%)
3.Mineral fuels including oil: $75.8 billion (9.8%)
4.Electrical machinery and equipment: $69.3 billion (8.9%)
5.Pharmaceuticals: $40.2 billion (5.2%)
6.Plastics and plastic articles: $27.2 billion (3.5%)
7.Optical, technical and medical apparatus: $24.9 billion (3.2%)
8.Aircraft and spacecraft: $17.3 billion (2.2%)
9.Iron or steel products: $14 billion (1.8%)
10.Organic chemicals: $13.7 billion (1.8%)
Combined, these top ten product groups accounted for nearly 59.6% of the total value of France's Import purchases from international markets.
Among the categories listed above, the fastest-growing imports between 2024 and 2025 were aircraft and spacecraft (up 26.2%), pharmaceutical products (up 21.5%), and machinery including computers (up 12.4%).
In contrast, the most notable decline occurred in mineral fuels including oil, where France's Import spending dropped by 13.6% compared with 2024.
France Import Companies
For businesses planning to enter the French import market, locating trustworthy buyers is a crucial step. By using Tendata's data analysis tools, including keyword searches and HS code filtering, companies can quickly identify thousands of verified importers, review purchasing trends, and obtain key contact information—greatly reducing the time needed to access the market.
For instance, when analyzing cotton demand in France, Tendata's platform can instantly identify the top 10 buyers in the French market for 2025.
1.KIABI LOGISTIQUE (3.85%, $42.81 Million)
2.SIPLEC (3.78%, $42.11 Million)
3.SAS KIABI LOGISTIQUE (3.62%, $40.25 Million)
4.CARREFOUR IMPORT SAS (2.78%, $30.95 Million)
5.ELIS SERVICES (2.1%, $23.34 Million)
6.ACTION SERVICE AND DISTRIBUTIE B V (1.93%, $21.49 Million)
7.DECATHLON SPORTS IRELAND LTD (1.9%, $21.16 Million)
8.LA REDOUTE (1.87%, $20.83 Million)
9.NA PALI SAS (1.52%, $16.87 Million)
10.PEGASE (1.25%, $13.94 Million)
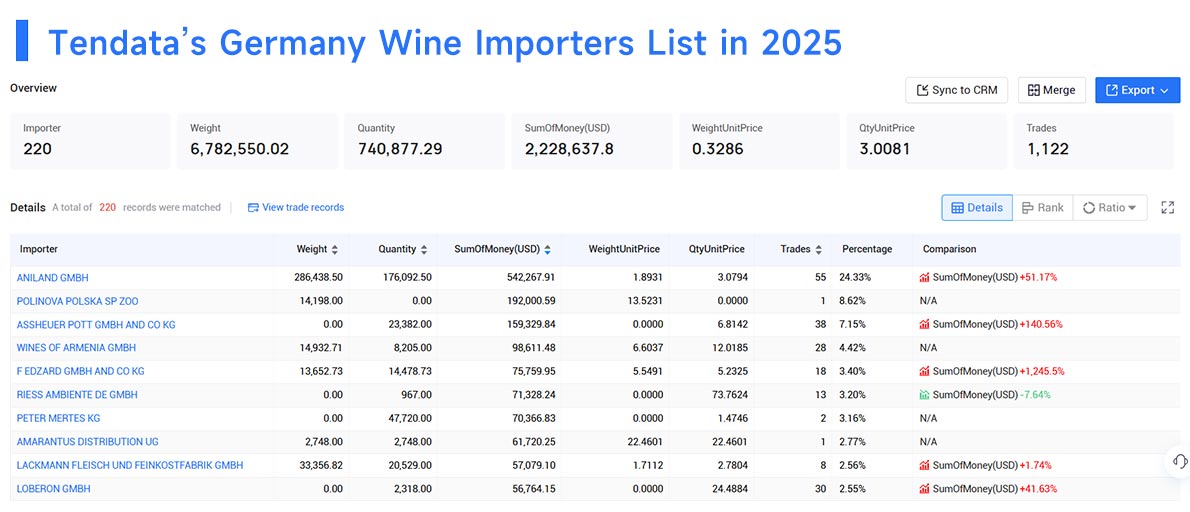
Whether you are an experienced international trader or a newcomer, analyzing France's Import data can help uncover valuable business opportunities. For more detailed insights into French import statistics or trade data, contact Tendata to request a free online demonstration.
Category
Leave Message for Demo Request or Questions



















