
 Tendata AI
  Exhibition
 B2B Platforms
 Standalone Website
 Social Media
 Emails
 Import News
 2026-03-27
Keypoints
· Moderate Scale with Fragmented Demand
The global handicraft import market includes 4,582 importers across 82 countries, generating USD 45.08 million from 39,805 transactions. This reflects a fragmented but active trade structure, with no single buyer dominating globally.
· Highly Concentrated Country-Level Demand
Brazil, Vietnam, and Colombia together account for over 80% of total import value, indicating a top-heavy market structure where a few countries drive the majority of demand.
· Textile & Apparel Categories Lead Trade
Major HS codes such as 62040000 and 62060000 show that handicraft imports are closely linked to textile and apparel products, especially culturally designed garments and accessories.
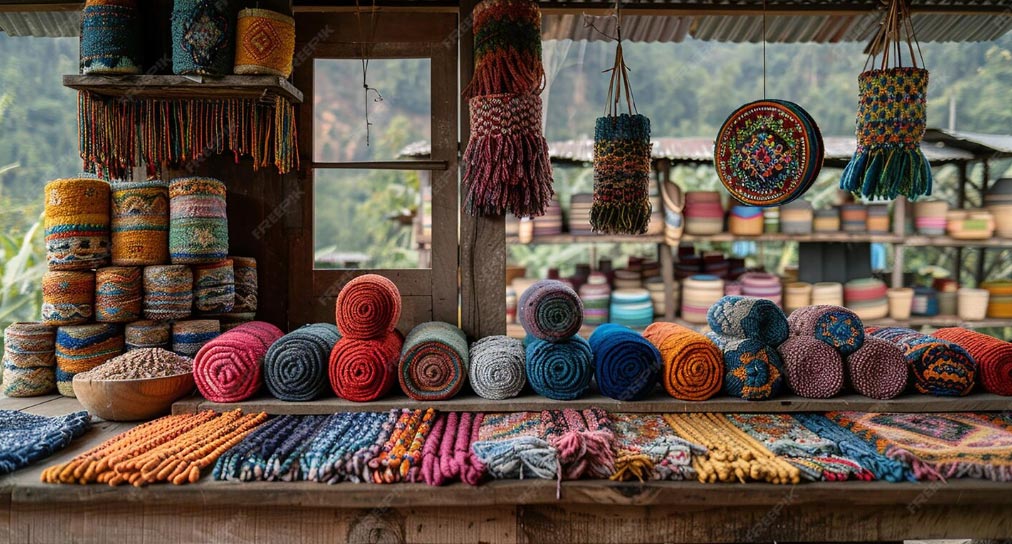
Understanding the top handicraft importing countries, major buyers, and key HS codes provides valuable insight into global demand patterns, product positioning, and evolving trade dynamics. This article explores the handicraft import market based on global trade data, highlighting leading importing countries, importer profiles, trade values, product categories, and key trends, helping businesses better capture opportunities in the global handicraft trade.
Global Handicraft Import Data: 2025 Overview
The global handicraft import market in 2025 reflects a niche yet steadily expanding segment within international trade, driven by rising demand for handmade, cultural, and sustainable products. According to Tendata trade data, the market involves 4,582 importers across 82 countries, generating a total import value of USD 45.08 million from 39,805 transactions, indicating a moderately active and fragmented trade network.
List of Major Handicraft Importing HS Codes
According to Tendata global trade data, here is the list of top handicraft HS Codes in 2025:
1.HS Code:62040000(10.24%,$0.45 million):Women's or girls' suits, ensembles, jackets, blazers, dresses, skirts, divided skirts, trousers, bib and brace overalls, breeches and shorts (excluding knitted or crocheted, wind-jackets and similar articles, slips, petticoats and panties, tracksuits, ski suits, swimwear, bathing costumes and beach caps)
2.HS Code:62060000(8.29%,$0.23 million):Women's or girls' blouses, shirts and shirt-blouses.
3,HS Code:62080000(2.50%,$0.02 million):Women's or girls' singlets and other vests, slips, petticoats, briefs, panties, nightdresses, pyjamas, négligés, bathrobes, dressing gowns, housecoats and similar articles (excluding knitted or crocheted, brassieres, girdles, corsets and similar articles)
4.HS Code:62140000(1.49%,$0.15 million):Shawls, scarves, mufflers, mantillas, veils and similar articles (excl. of silk)
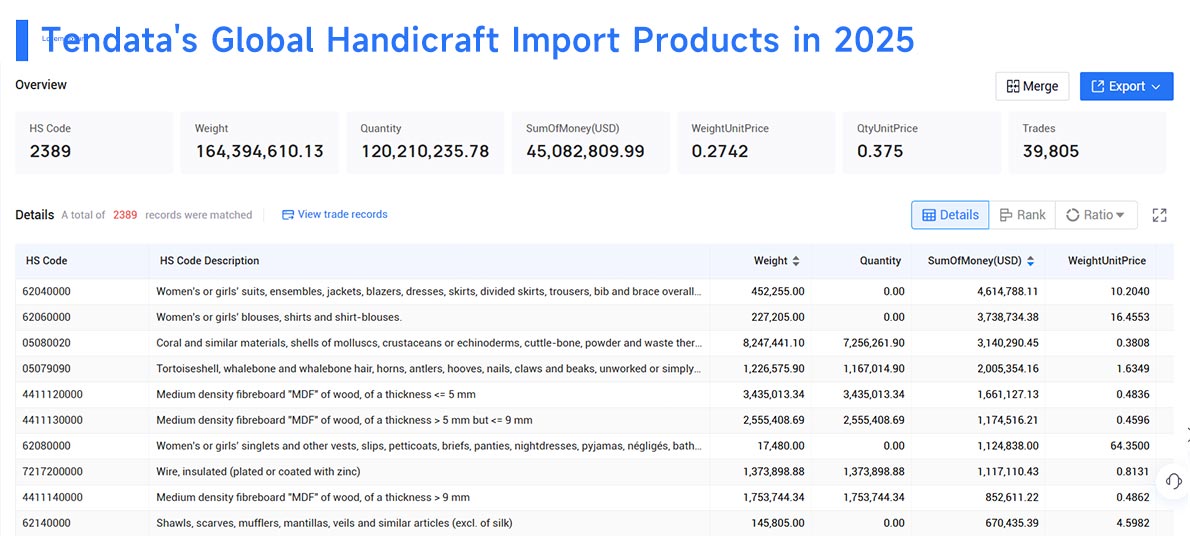
The global handicraft import market is shaped by a diverse HS code structure, with demand spanning across apparel-based handicrafts and textile-related products. According to Tendata trade data, HS Code 62040000 leads with a 10.24% share (USD 0.45 million), covering a wide range of women’s garments such as dresses, skirts, and suits, which are often associated with handcrafted or culturally designed apparel.
Other key categories include HS Code 62060000 (8.29%, USD 0.23 million) for women’s blouses and shirts, and HS Code 62080000 (2.50%, USD 0.02 million), which includes intimate apparel and loungewear. Additionally, HS Code 62140000 (1.49%, USD 0.15 million) represents accessories such as shawls and scarves, which are commonly linked to traditional handicraft production.
This HS code distribution highlights that the handicraft import market is closely tied to textile and apparel segments, particularly products with cultural, artisanal, or design-driven value. For exporters, focusing on design differentiation, craftsmanship, and niche cultural appeal—along with aligning product classifications under the right HS codes—can help improve visibility and competitiveness in the global handicraft trade.
Top Handicraft Importing Countries
According to Tendata global trade data, below is the list of major handicradt importing countries in 2025:
1.Brazi(39.53%,$17.82 million)
2.Vietnam(22.32%,$10.06 million)
3.Colombia(18.88%,$8.51 million)
4.India(8.76%,$3.95 million)
5.Peru(2.98% ,$1.34 million)
6.Malaysia(1.40% ,$0.63 million)
7.Kazakhstan(1.21%,$0.55 million)
8.Ecuador(0.85%, $0.38 million)
9.Ukraine(0.60%,$0.27 million)
10.Philippines(0.56%,$0.25 million)
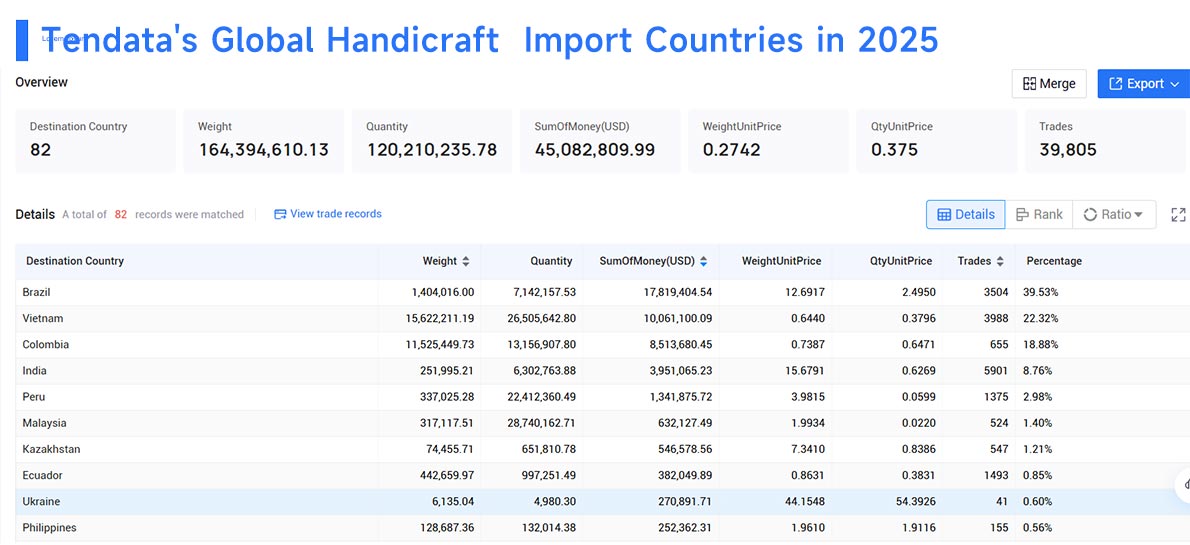
The global handicraft import market in 2025 shows a highly concentrated demand pattern, with a few key countries accounting for the majority of total import value. According to Tendata trade data, Brazil dominates the market with a 39.53% share (USD 17.82 million), followed by Vietnam (22.32%, USD 10.06 million) and Colombia (18.88%, USD 8.51 million). Together, these top three countries contribute over 80% of global handicraft import value, indicating a strong regional concentration in Latin America and Southeast Asia.
Other notable importing countries include India (8.76%), along with smaller markets such as Peru, Malaysia, Kazakhstan, and Ecuador, each contributing modest but stable demand. Meanwhile, Ukraine and the Philippines represent emerging or niche markets, offering additional opportunities for exporters seeking diversification.
Top Global Handicraft Importers in 2025
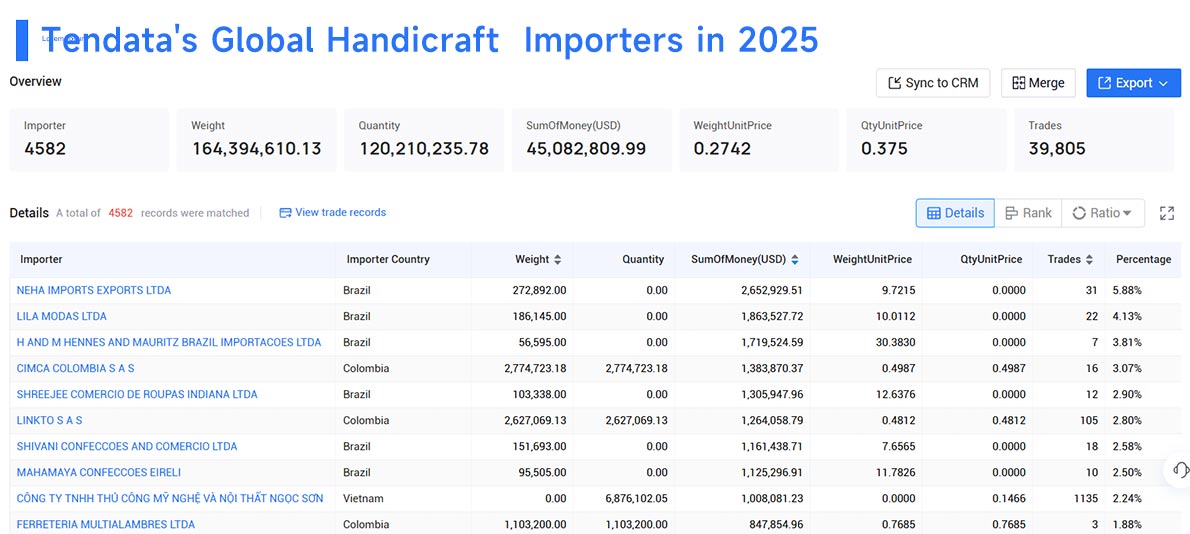
According to Tendata global trade data, here is the list of top handicraft importers worldwide in 2025:
1.NEHA IMPORTS EXPORTS LTDA(5.88%,$2.65 million)
2.LILA MODAS LTDA(4.13%,$1.86 million)
3.H AND M HENNES AND MAURITZ BRAZIL IMPORTACOES LTDA(3.81%,$1.72 million)
4.CIMCA COLOMBIA S A S(3.07%,$1.38 million)
5.SHREEJEE COMERCIO DE ROUPAS INDIANA LTDA(2.90%,$1.31 million)
6.LINKTO S A S(2.80%,$1.26 million)
7.SHIVANI CONFECCOES AND COMERCIO LTDA(2.58%,$1.16 million)
8.MAHAMAYA CONFECCOES EIRELI(2.50% ,$1.13 million)
9.CÔNG TY TNHH THỦ CÔNG MỸ NGHỆ VÀ NỘI THẤT NGỌC SƠN (2.24% ,$1.01 million)
10.FERRETERIA MULTIALAMBRES LTDA(1.88%,$0.85 million)
How to find Handicraft Products Import Data?
To effectively access and analyze handicraft import data, businesses can rely on professional platforms like Tendata, which provide comprehensive global trade intelligence and buyer-level insights. By entering keywords such as “handicraft” or relevant HS codes, users can quickly retrieve detailed import records, including transaction values, shipment frequency, supplier–buyer relationships, and pricing trends.
In practice, exporters can use Tendata to filter handicraft import data by country, company, or time period, helping them identify repeat buyers and high-potential markets. This data-driven approach allows businesses to move beyond generic targeting and focus on verified importers with real purchasing activity, improving efficiency and increasing success rates in the global handicraft trade.
Final Words
The global handicraft import market in 2025 reflects a small but strategically valuable segment within a much larger global industry, supported by growing consumer demand for handmade, sustainable, and culturally distinctive products. While total import value stands at USD 45.08 million, the broader handicrafts market globally is already valued in the hundreds of billions and continues to expand steadily.
A key characteristic of this market is its dual structure: a few dominant importing countries such as Brazil, Vietnam, and Colombia drive the majority of trade, while a wide base of smaller markets ensures long-term demand stability and diversification opportunities. At the same time, the strong presence of textile and apparel-related HS codes highlights the importance of design, craftsmanship, and cultural value in shaping product competitiveness.
FAQ
1. What is the current size and structure of the handicraft import market?
Based on Tendata data, the handicraft import market in 2025 includes 4,582 importers across 82 countries, with a total trade value of USD 45.08 million and nearly 40,000 transactions. While the import scale is relatively niche, it is part of a much larger global handicrafts industry valued at hundreds of billions of dollars and growing steadily , indicating strong long-term demand potential.
2. Which countries are the main handicraft importers?
The market is highly concentrated, led by Brazil, Vietnam, and Colombia, which together account for over 80% of total import value. Other countries such as India, Peru, and Malaysia contribute smaller but stable demand, creating both high-volume and niche market opportunities.
3. What types of handicraft products are most commonly imported?
Handicraft imports are mainly concentrated in textile and apparel-related HS codes, including garments, blouses, and accessories such as scarves and shawls. This reflects strong global demand for design-driven, culturally inspired, and handmade textile products.
4. How can I find reliable handicraft importers using Tendata?
Tendata allows users to search by product keywords or HS codes to identify active handicraft importers. You can access shipment records, transaction frequency, supplier relationships, and buyer profiles, helping you focus on verified companies with real purchasing activity rather than unqualified leads.
5. How does Tendata help improve export performance in the handicraft market?
In a fragmented market like handicrafts, Tendata enables precision targeting by helping exporters identify repeat buyers, analyze purchasing cycles, and track market trends. This reduces blind outreach and allows businesses to prioritize high-potential markets and customers, ultimately improving conversion rates and supporting sustainable growth.
Category
Leave Message for Demo Request or Questions



















