
 Tendata AI
  Exhibition
 B2B Platforms
 Standalone Website
 Social Media
 Emails
 Import News
 2026-03-31
Keypoints
·Strong Market Scale with Steady Growth
The global tea import market remains sizable and resilient, with total trade value exceeding $6.6 billion and supported by consistent consumption growth. Global import volumes reached over 1,088 K tons in 2024, reflecting a ~6.5% annual increase, indicating stable long-term demand for tea products worldwide.
·Wide Global Coverage with Active Buyer Network
The market includes 38,000+ importers across 140+ countries, indicating a highly fragmented yet active buyer ecosystem. This creates opportunities for exporters to target both large-volume buyers and niche importers with specialized demand.

The global tea trade plays a vital role in supporting the food and beverage industry, retail consumption, and cultural traditions across the world. From bulk black tea used in daily consumption to premium green and specialty teas, tea imports continue to drive international trade and steady market growth. Understanding the top international tea importing countries provides valuable insight into global demand patterns, consumption preferences, and evolving sourcing strategies. This blog explores key tea import markets based on global trade data, highlighting major importing countries, active international tea importers, tea HS codes, and other important trends shaping the global tea trade landscape.
Explore the International Tea Importers market in 2025 with data-driven insights on top importing countries, key HS codes, and global trade trends. This article analyzes over 38,000 importers across 148 countries, revealing market concentration, dominant tea product segments, and emerging demand patterns. Learn how to identify high-value tea buyers, track purchasing behavior, and leverage trade data to expand your global tea export business efficiently.
Overview of the International Tea Importers Market
The global tea trade has evolved into a dynamic and widely distributed import network, supported by strong consumer demand and expanding beverage diversification worldwide. In 2025, the international tea import market demonstrates substantial scale and activity, with 38,212 importers across 148 countries, generating a total import value of USD 6.65 billion from 841,699 trade transactions. This reflects a highly fragmented yet active buyer landscape, where both large distributors and small-to-medium importers participate in frequent cross-border sourcing.
International Tea Importers Data: 2025 Analysis
List of Major Tea Importing HS Codes
According to Tendata global trade data, here is the list of top tea HS Codes in 2025
1.HS Code:9024090(19.83%,$1,319,443,126.05)
2.HS Code:9024000(4.41%,$293,792,125.83)
3.HS Code:9024020(4.06%,$270,300,818.11)
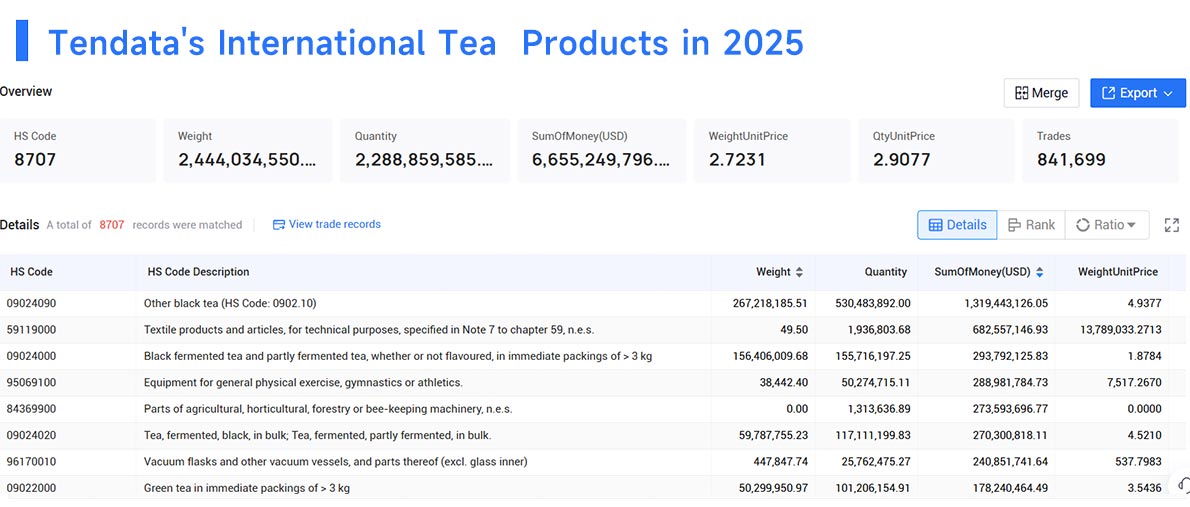
These figures indicate that black tea dominates the global import structure, especially in bulk and semi-processed forms, driven by high consumption in key markets such as Europe, the Middle East, and emerging economies. Meanwhile, other subcategories under HS 0902—such as green tea (0902.10 / 0902.20)—continue to grow, supported by health-oriented consumption trends and premium product positioning.
Top International Tea Importing Countries
According to Tendata global trade data, below is the list of major international tea importing countries in 2025:
1.Brazi(43.87%,$2,919,454,775.70)
2.Pakistan(24.71%,$1,644,198,826.29)
3.Kenya (4.60%,$306,236,724.67)
4.India(3.85%,$256,404,808.12)
5.Vietnam(3.05%,$203,009,090.05)
6.Kazakhstan(2.52%,$167,611,737.38)
7.Russia(2.36%,$156,921,059.17)
8.Uzbekistan(1.85%,$122,901,952.52)
9.Indonesia(1.64%,$109,174,145.19)
10.Ukraine(1.39% ,$92,229,070.04)
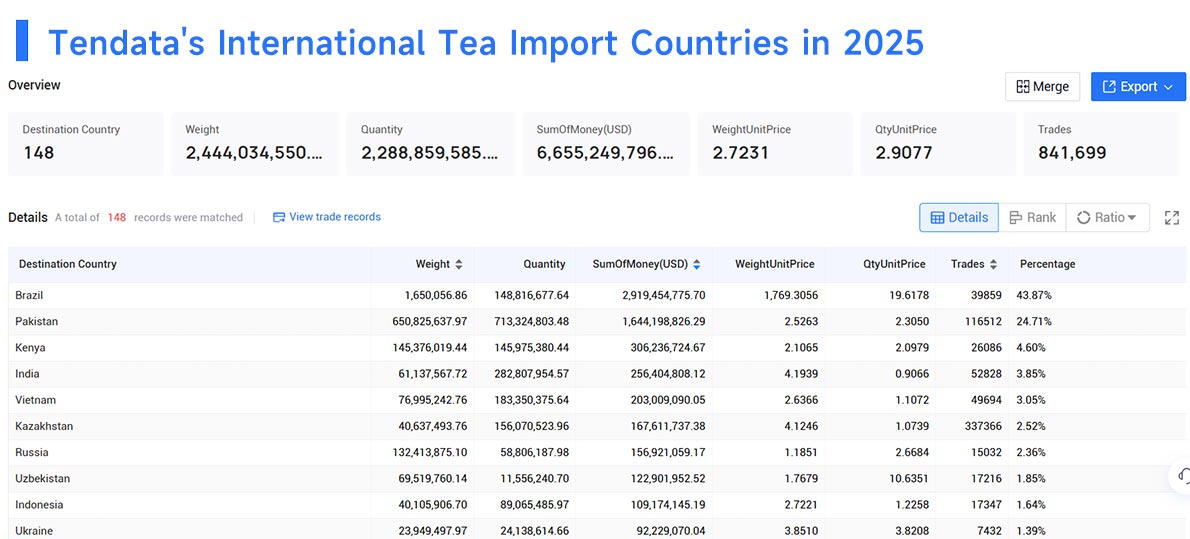
According to Tendata global trade data, the international tea import market in 2025 shows a highly concentrated geographic structure, with demand heavily clustered in a few key countries. Among all importing nations, Brazil dominates the global landscape, accounting for 43.87% of total imports ($2.92 billion), making it the largest tea importer by a significant margin. This is followed by Pakistan at 24.71% ($1.64 billion), reflecting strong and stable consumption driven by deeply rooted tea-drinking culture.
Beyond the top two markets, the remaining demand is distributed across a mix of producing and consuming countries. Kenya (4.60%) and India (3.85%), despite being major tea producers, also engage in imports to support re-export, blending, and domestic consumption diversification. Emerging Asian markets such as Vietnam (3.05%) and Indonesia (1.64%) highlight growing regional demand and evolving consumption patterns.
Meanwhile, Central Asia and Eastern Europe—including Kazakhstan (2.52%), Uzbekistan (1.85%), Russia (2.36%), and Ukraine (1.39%)—represent stable, volume-driven markets where tea remains a daily staple beverage.
Top International Tea Importers in 2025
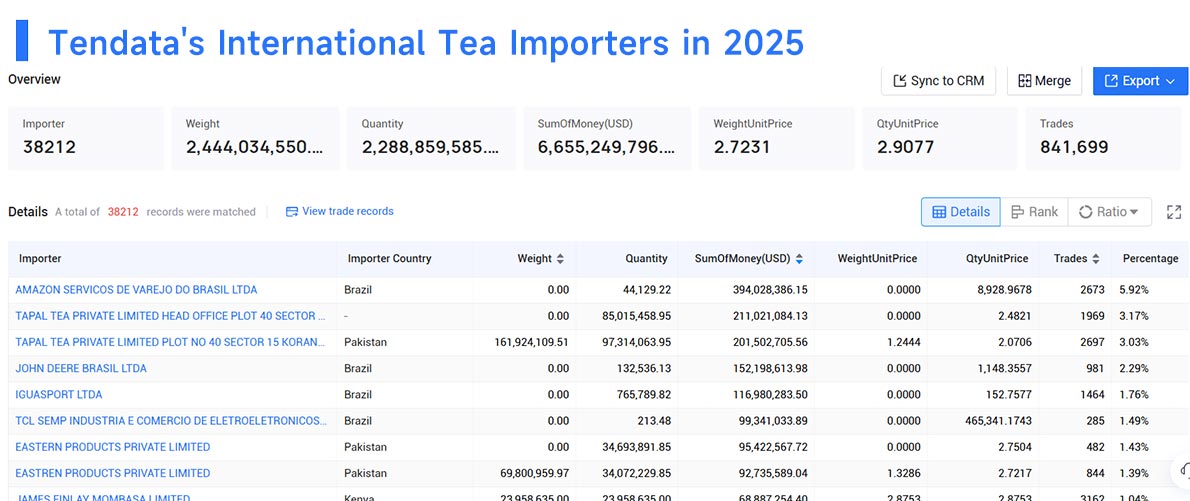
According to Tendata global trade data, here is the list of top auto part importers worldwide in 2025:
1.AMAZON SERVICOS DE VAREJO DO BRASIL LTDA(5.92%,$394,028,386.15)
2.TAPAL TEA PRIVATE LIMITED HEAD OFFICE PLOT 40 SECTOR 15 KORANGI INDUSTRIAL AREA KARACHI(3.17%,$211,021,084.13)
3.TAPAL TEA PRIVATE LIMITED PLOT NO 40 SECTOR 15 KORANGI INDUSTRIAL AREA KARACHI(3.03% ,$201,502,705.56)
4.JOHN DEERE BRASIL LTDA(2.29% ,$152,198,613.98)
5.IGUASPORT LTDA(1.76% ,$116,980,283.50)
How to find International Tea Products Import Data?
To identify active international tea importers, companies typically rely on global trade databases that aggregate customs records, shipping data, and statistical reports. These datasets include critical fields such as importer names, shipment values, quantities, origin/destination countries, and transaction dates, allowing exporters to pinpoint high-frequency buyers and evaluate market potential . By filtering data using HS codes (e.g., 0902 for tea), users can quickly isolate relevant trade flows and uncover demand trends by region, product type, and time period.
Platforms like Tendata enhance this process by integrating multi-country customs data with business intelligence and AI-driven analytics. Instead of only providing raw shipment records, Tendata enables users to identify high-value tea importers, track purchasing cycles, analyze competitor activity, and access verified contact information of decision-makers. This transforms traditional trade data into actionable insights—helping exporters move from market research to precise customer acquisition.
Final Words
In summary, the international tea import market in 2025 reflects a combination of strong demand, concentrated buyer distribution, and evolving consumption trends. With over tens of thousands of importers operating across more than 100 countries, the market remains highly active and globally interconnected, offering significant opportunities for exporters seeking to expand their reach. At the same time, demand continues to grow steadily at around 6–7% annually, driven by rising health awareness and the increasing popularity of premium and specialty tea products .
However, the market is not without complexity. Import demand is heavily concentrated in a few key countries, while supply-side pressures—such as climate impact, cost fluctuations, and quality control requirements—are pushing buyers to diversify sourcing and prioritize reliable partners. This makes it essential for exporters to go beyond traditional market selection and adopt a more precise, data-driven approach.
By using tools like Tendata, businesses can move from broad market analysis to actionable execution—identifying real buyers, tracking purchasing behavior, and targeting high-potential importers with proven demand. In a competitive and data-rich global tea trade environment, those who can effectively combine trade data insights with market timing will be best positioned to achieve sustainable growth.
FAQ
1.How can I find reliable international tea importer data?
The most effective method is to use global trade databases that compile customs records and shipment-level data. By searching with HS Code 0902, you can identify active importers, transaction volumes, shipment frequency, and sourcing countries, which helps validate real market demand and avoid low-quality leads.
2.What key data fields should I analyze when targeting tea importers?
High-quality trade data typically includes importer names, shipment value (USD), quantity, trade frequency, origin country, and transaction dates. These indicators help exporters identify high-value buyers, evaluate purchasing cycles, and prioritize markets with consistent demand.
3.How does Tendata help identify international tea importers more efficiently?
Tendata integrates multi-country customs data with AI-driven analytics, enabling users to quickly filter tea importers by HS code, analyze buyer activity, and uncover high-potential customers. Beyond raw data, it also provides company profiles and contact insights, helping businesses move directly from data analysis to customer development.
Category
Leave Message for Demo Request or Questions



















