
 Tendata AI
  Exhibition
 B2B Platforms
 Standalone Website
 Social Media
 Emails
 Import News
 2026-04-07
In 2025, Indonesia's imports reached a total value of US$241.9 billion from global markets, marking a 23.6% increase compared to the $195.7 billion recorded five years earlier in 2021.
On an annual basis, Indonesia's imports grew by a more modest 3.5% , rising from $233.7 billion in 2024.
When measured using the average exchange rate for 2025, the Indonesian rupiah strengthened by 15.1% against the U.S. dollar relative to 2024. This appreciation meant that Indonesia's imports—priced in the comparatively weaker U.S. dollar—became less expensive when converted from the rupiah.
In terms of domestic inflation, Indonesia's average consumer price inflation stood at 1.683% in 2025, down from 2.3% in the previous year.

Major Suppliers of Indonesia's Imports
According to the most recent country-specific trade data, 79.2% of Indonesia's imports originated from the following economies: mainland China (36.2% of Indonesia's total), Singapore (7.9%), Japan (6%), the United States (5.3%), Malaysia (4.6%), Australia (3.9%), Thailand (3.7%), South Korea (3.3%), Vietnam (2.5%), India (2%), Brazil (1.98%), and Taiwan (1.8%).
From a continental perspective, nearly three-quarters (74.7% ) of Indonesia's imports by value came from other Asian nations. European countries supplied 7.6% , while North American providers accounted for 6.9% .
Smaller shares of Indonesia's imports originated from Oceania (including Australia and New Zealand) at 4.4% , Africa at 3.6% , and Latin America (including the Caribbean but excluding Mexico) at 2.9% .
With a population of approximately 284.4 million people, Indonesia's imports of $241.9 billion in 2025 translate to about $850 per person in annual product demand—slightly higher than the $830 per capita recorded in 2024.
Indonesia's Top 10 Import Categories (2025)
Below are the product categories that generated the highest dollar value within Indonesia's imports during 2025, along with their percentage share of total Indonesia's imports:
1.Mineral fuels (including oil): $36.8 billion (15.2%)
2.Machinery (including computers): $36.6 billion (15.2%)
3.Electrical machinery and equipment: $31.9 billion (13.2%)
4.Vehicles: $11 billion (4.5%)
5.Plastics and plastic articles: $10.4 billion (4.3%)
6.Iron and steel: $9.5 billion (3.9%)
7.Organic chemicals: $6.3 billion (2.6%)
8.Miscellaneous chemical goods: $5.19 billion (2.1%)
9.Gems and precious metals: $5.16 billion (2.1%)
10.Optical, technical, and medical apparatus: $4.8 billion (2%)
Together, these top 10 categories represented nearly two-thirds (65.2%) of total Indonesia's imports.
Fastest-growing categories (2024–2025) among Indonesia's imports included: miscellaneous chemical goods (+40.1%), electrical machinery and equipment (+17.9%), vehicles (+13.9%), and machinery including computers (+9.3%).
Meanwhile, declining categories within Indonesia's imports were organic chemicals (-12.1%) and iron and steel (-10.7%).
Top 4-Digit Import Products
At a more detailed level, the most valuable individual products within Indonesia's imports were: processed petroleum oils (7.9% of total imports), crude oil (3.8%), smartphones and other phone devices (3.8%), computers and optical readers (2.3%), unwrought gold (2%), electronic integrated circuits and microassemblies (1.9%), petroleum gases (1.6%), cars (1.5%), coal including solid coal-based fuels (1.4%), and wheat (1.4%).
Top 10 Importers/Companies in Indonesia (2025)
For businesses seeking to enter the Indonesian import market, identifying reliable buyers is crucial. Analyzing Indonesia's imports data can provide a significant competitive advantage. Using Tendata's advanced tools—such as keyword search and HS code filters—companies can quickly locate thousands of verified buyers, analyze purchasing trends, and access contact information, significantly reducing market entry time.
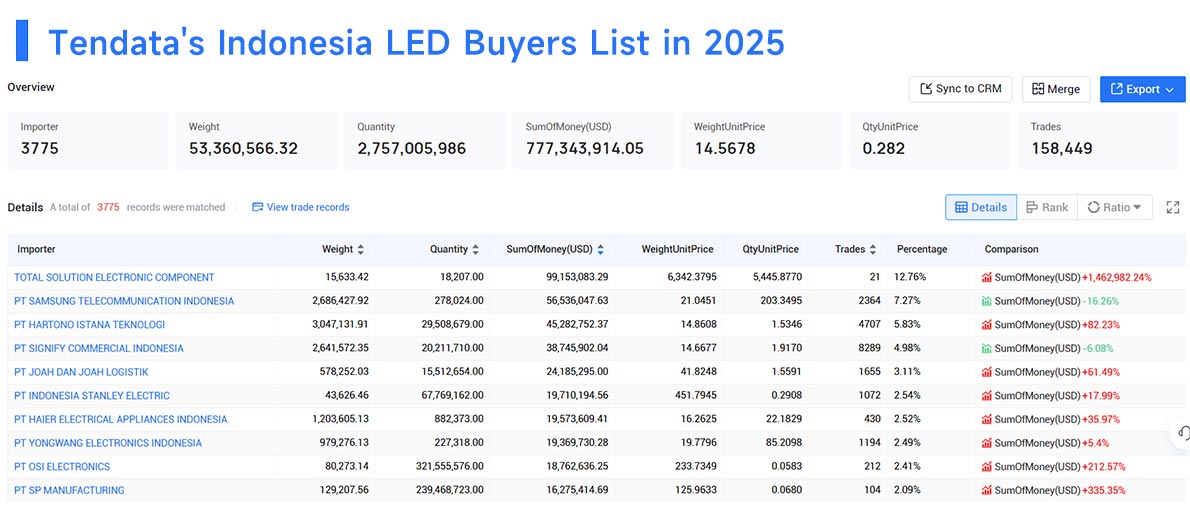
For example, when researching LED demand, Tendata's platform can instantly show the top 10 Indonesian buyers for 2025 based on Indonesia's imports records:
>>Find More Indonesia Suppliers
1.TOTAL SOLUTION ELECTRONIC COMPONENT(12.76%, $99.15 Million)
2.PT SAMSUNG TELECOMMUNICATION INDONESIA(7.27%, $56.54 Million)
3.PT HARTONO ISTANA TEKNOLOGI(5.83%, $45.28 Million)
4.PT SIGNIFY COMMERCIAL INDONESIA(4.98%, $38.75 Million)
5.PT JOAH DAN JOAH LOGISTIK(3.11%, $24.19 Million)
6.PT INDONESIA STANLEY ELECTRIC(2.54%, $19.71 Million)
7.PT HAIER ELECTRICAL APPLIANCES INDONESIA(2.52%, $19.57 Million)
8.PT YONGWANG ELECTRONICS INDONESIA(2.49%, $19.37 Million)
9.PT OSI ELECTRONICS(2.41%, $18.76 Million)
10.PT SP MANUFACTURING(2.09%, $16.28 Million)
Whether you are an experienced trader or just starting out, using detailed Indonesia's imports data can uncover valuable market opportunities. For more information on Indonesia's imports statistics or trade data, contact Tendata for a free online demo.
FAQ
1. What are Indonesia's main imports in 2025?
Indonesia's top imports include mineral fuels (such as oil), machinery and computers, electrical equipment, vehicles, plastics, and iron and steel. These categories account for the majority of the country's import value.
2. Which countries are Indonesia's largest suppliers?
Indonesia primarily imports from mainland China, Singapore, Japan, the United States, and Malaysia. Other key suppliers include Australia, Thailand, South Korea, and Vietnam.
3. Which import categories are growing the fastest?
The fastest-growing import sectors include miscellaneous chemical goods, electrical machinery, vehicles, and machinery such as computers, reflecting rising industrial and consumer demand.
4. How can businesses identify potential buyers in Indonesia?
Companies can use trade data platforms like Tendata to analyze Indonesia's import records, identify active buyers, track purchasing trends, and access contact details for business development.
Category
Leave Message for Demo Request or Questions



















