
 Tendata AI
  Exhibition
 B2B Platforms
 Standalone Website
 Social Media
 Emails
 Import News
 2026-04-08
Keypoints
·Analysis of US aluminum imports by country shows a highly concentrated supply structure, with Canada dominating the market and contributing the majority share, followed by key suppliers such as the United Arab Emirates and China.
·The U.S. imports aluminum from 100+ countries, but over 80% of total import value is concentrated among top trading partners, indicating both efficiency in sourcing and potential supply chain risks.
·From a product perspective, imports are heavily skewed toward primary aluminum (unwrought) and upstream materials, reflecting a supply chain model where the U.S. depends on global raw material sourcing while focusing domestically on downstream manufacturing.

The global aluminum trade plays a vital role in supporting industries such as transportation, construction, packaging, and energy across the world. From primary unwrought aluminum to semi-finished and fabricated products, aluminum imports are essential for sustaining industrial production and infrastructure development.
Understanding US aluminum imports by country provides valuable insight into global supply chains, sourcing dependencies, and evolving trade dynamics. This analysis highlights key supplier countries, major aluminum HS Codes, import structure, and market trends, helping businesses better identify opportunities, assess risks, and optimize their strategies in the competitive global aluminum market.
US Aluminum Import Data: 2025 Overview
According to global trade data, the United States recorded 12,150 aluminum importers, sourcing from 107 origin countries, with a total of 92,534 trade shipments, reflecting a highly fragmented yet globally integrated supply network. The U.S. aluminum import market is strongly dominated by a few key suppliers, with Canada accounting for over 40% of total import value, followed by countries such as China, Mexico, the United Arab Emirates, and South Korea . In fact, the U.S. relies heavily on external supply, with roughly half of domestic aluminum demand met through imports, highlighting structural dependence on international sourcing.
List of Major US Aluminum Importing HS Codes
According to Tendata trade data, here is the list of top US aluminum HS Codes in 2025:
1.HS Code:760110(62.18%):Aluminum, not alloyed, unwrought
2.HS Code:760120(20.20%):Unwrought aluminium alloys
3.HS Code:760612(1.45%):Plates, sheets and strip, of aluminium alloys, of a thickness of > 0,2 mm, square or rectangular (excl. expanded plates)
4.HS Code:870870(1.26%):Road wheels and parts and accessories thereof, for tractors, motor vehicles for the transport of ten or more persons, motor vehicles for the transport of goods and special purpose motor vehicles
5.HS Code:760200(0.97%):Waste and scrap, of aluminium (excl. slags, scale and the like from iron and steel production, containing recoverable aluminium)
6.HS Code:761010(0.88%):Structures and parts of structures "e.g., bridges and bridge-sections, towers, lattice masts, pillars and columns, roofs"
7.HS Code:281830(0.80%):Aluminium hydroxide
8.HS Code:721070(0.69%):Flat products of iron or non-alloy steel, of a width of >= 600 mm, not hot-rolled or cold-rolled "cold-reduced", painted
9.HS Code:761510(0.65%):Table, kitchen or other household articles and parts thereof, of aluminium
10.HS Code:761699(0.65%):Articles of aluminium, n.e.s.
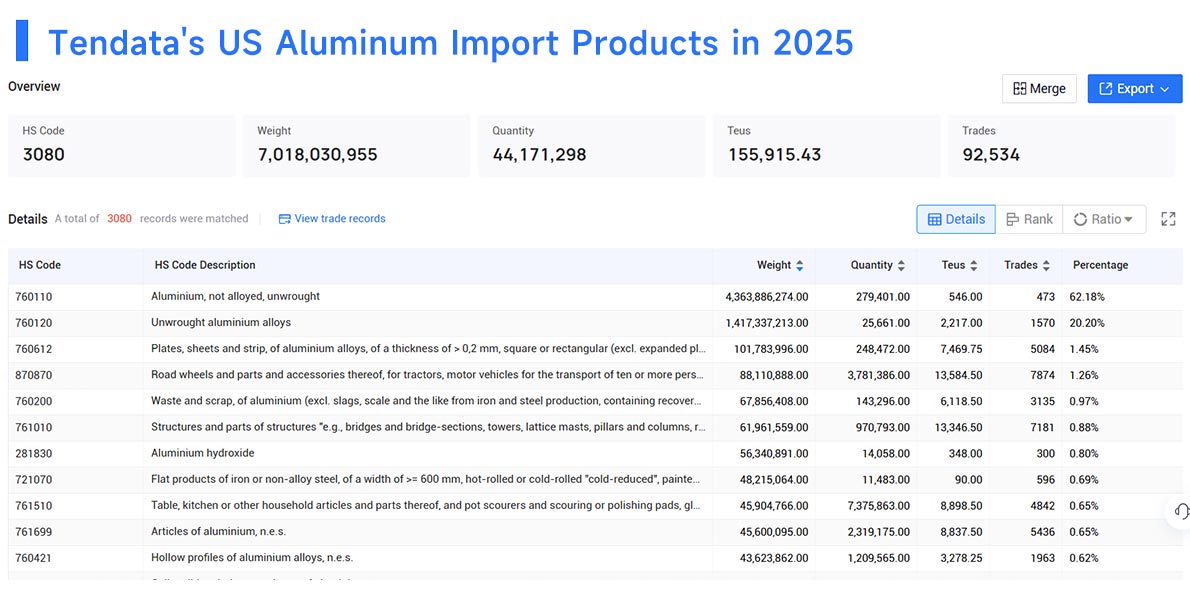
According to Tendata trade data, analyzing US aluminum imports by country and product structure reveals that the U.S. aluminum market is heavily concentrated in primary and semi-finished materials, with unwrought aluminum dominating total import volume. This structure highlights strong downstream manufacturing demand and continuous reliance on global suppliers under the broader trend of US aluminum importing by country.
From a structural perspective, HS Code 760110 and 760120 together account for over 82% of total imports, indicating that the U.S. primarily imports raw and semi-processed aluminum rather than high-value finished goods. This reflects a supply chain model where upstream materials are sourced globally, while downstream fabrication and value-added production are completed domestically.
In addition, the presence of categories such as aluminium scrap (760200) and aluminium hydroxide (281830) suggests a growing emphasis on recycling, sustainability, and chemical processing within the U.S. aluminum ecosystem. Meanwhile, smaller shares of finished and consumer-related products (e.g., 761510, 761699) indicate niche but stable demand segments.
Top US Aluminum Importing Countries
According to Tendata trade data, below is the list of major US aluminum importing countries of origin in 2025:
1.Canada (61.80%)
2.United Arab Emirates (19.86%)
3.China (6.59%)
4.South Korea (2.02%)
5.Vietnam (1.63%)
6.Colombia (1.32%)
7.Thailand (0.65%)
8.Brazil (0.58%)
9.Germany (0.54%)
10.Qatar (0.43%)
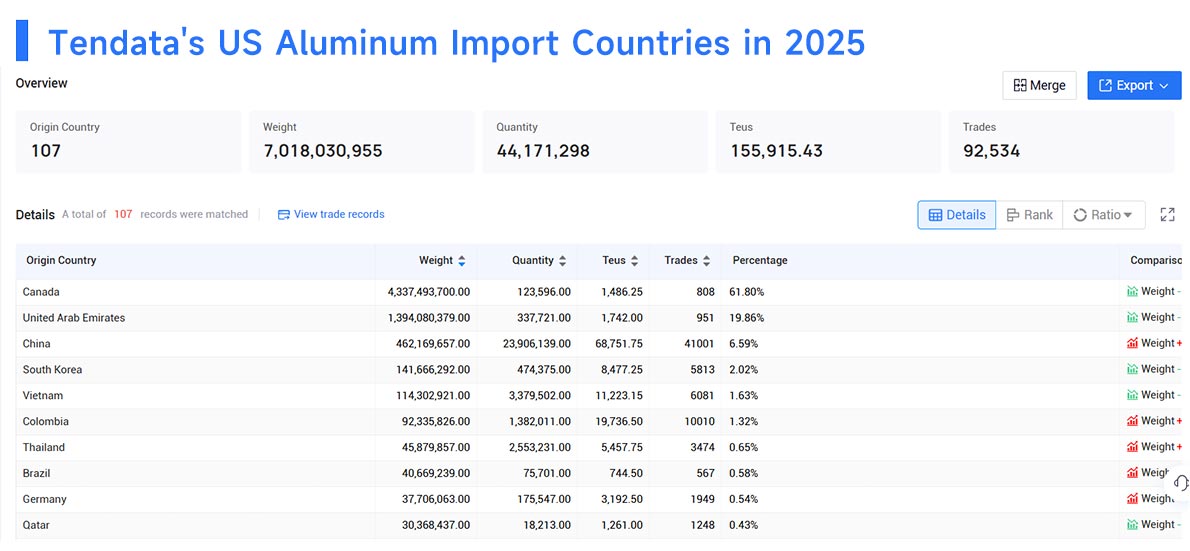
According to Tendata trade data, the U.S. aluminum import structure in 2025 is highly concentrated among a few key supplier countries, reflecting both geographic advantages and long-term trade relationships under the broader trend of US aluminum importer by country.
Canada dominates the U.S. aluminum import market, accounting for 61.80% of total imports. Its strong position is driven by geographic proximity, integrated North American supply chains, and stable trade agreements. The United Arab Emirates ranks second with 19.86%, emerging as a major global aluminum supplier due to its large-scale primary aluminum production capacity and cost efficiency.
China follows with 6.59%, supplying a mix of semi-finished and downstream aluminum products, while South Korea (2.02%) and Vietnam (1.63%) play important roles in providing processed aluminum goods and supporting regional diversification. Other countries such as Colombia (1.32%), Thailand (0.65%), Brazil (0.58%), Germany (0.54%), and Qatar (0.43%) contribute smaller but strategically relevant shares, helping the U.S. maintain a diversified sourcing portfolio.
From a structural perspective, the top two suppliers alone account for over 80% of total imports, indicating a high level of supplier concentration. This concentration creates both efficiency advantages and potential supply risks, especially in the context of geopolitical changes, tariffs, and energy-driven production shifts.
Top US Aluminum Importers in 2025
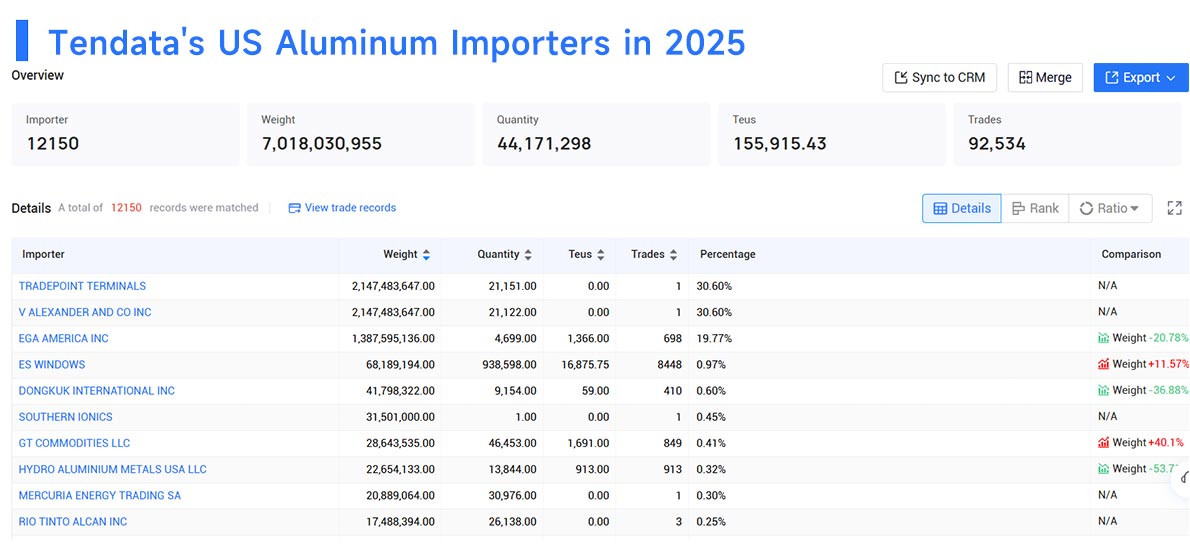
According to Tendata global trade data, here is the list of top US aluminumimporters worldwide in 2025:
1.TRADEPOINT TERMINALS V ALEXANDER AND CO INC (30.60%)
2.EGA AMERICA INC (19.77%)
3.ES WINDOWS (0.97%)
4.DONGKUK INTERNATIONAL INC (0.60%)
5.SOUTHERN IONICS (0.45%)
6.GT COMMODITIES LLC (0.41%)
7.HYDRO ALUMINIUM METAL S USA LLC (0.32%)
8.MERCURIA ENERGY TRADING SA (0.30%)
9.RIO TINTO ALCAN INC (0.25%)
10.SILFAB SOLAR WA INC (0.25%)
How to Find Aluminum Import Data with Tendata?
For businesses looking to analyze US aluminum imports by country, accessing accurate and structured trade data is critical to identifying real buyers, tracking sourcing patterns, and optimizing market entry strategies. The United States is one of the world’s largest aluminum importers, with import values exceeding $28 billion annually and a strong reliance on foreign supply chains . In fact, a significant portion of U.S. aluminum demand is met through imports, making country-level sourcing analysis essential for exporters and supplier
Tendata transforms fragmented trade statistics into actionable intelligence, allowing businesses to move beyond basic data and gain a comprehensive understanding of US aluminum imports by country, identify high-value customers, and build data-driven export strategies in a highly competitive global aluminum market.
Final Words
The global aluminum trade continues to evolve under the combined influence of supply chain restructuring, tariff policies, and shifting industrial demand. A clear understanding of US aluminum imports by country shows that the United States remains highly dependent on external suppliers, with a significant share of demand met through imports due to limited domestic smelting capacity . At the same time, the concentration of sourcing—particularly from key partners like Canada and the UAE—highlights both efficiency advantages and potential supply risks in the broader landscape of US aluminum importing by country.
From a product perspective, the dominance of unwrought aluminum and primary materials further confirms that the U.S. relies on global upstream supply while focusing domestically on downstream processing and manufacturing. Meanwhile, ongoing tariff adjustments and geopolitical factors continue to reshape trade flows, pricing structures, and sourcing strategies, making real-time data analysis more critical than ever.
In this context, Tendata provides a powerful solution for businesses seeking to navigate the complexity of aluminum trade. By integrating multi-source customs data, shipment-level records, and AI-driven analytics, Tendata enables users to deeply analyze US aluminum imports by country, identify stable buyers, and track procurement behavior with precision. From uncovering real importers with continuous purchasing activity to monitoring supplier shifts and price trends, Tendata transforms raw trade data into actionable market intelligence.
Ultimately, in a market defined by volatility and competition, using accurate data is no longer optional—it is essential. Businesses that effectively utilize tools like Tendata to interpret US aluminum importing by country will be better positioned to reduce risk, capture high-value opportunities, and build sustainable growth in the global aluminum trade
FAQ
1. What are US aluminum imports by country and why are they important?
US aluminum imports by country refer to the breakdown of aluminum sourcing based on supplier nations. This data is critical because the U.S. relies heavily on imports to meet domestic demand, with total imports reaching over $28 billion annually and coming from more than 100 countries . Understanding this structure helps businesses identify key supply markets such as Canada and the UAE, evaluate risks from supplier concentration, and optimize sourcing or export strategies.
2. How does Tendata help analyze US aluminum imports by country?
Tendata aggregates multi-source customs data and transforms it into structured, easy-to-use analytics. Users can quickly break down US aluminum imports by country, identify top suppliers, and track market share changes. More importantly, Tendata allows you to go beyond macro data by uncovering real importers, shipment frequency, pricing trends, and supplier relationships—helping businesses target high-value buyers and monitor procurement behavior.
3. Can Tendata identify real US aluminum importers?
Yes. Unlike traditional data sources, Tendata provides shipment-level records and filters for continuous buyers (e.g., importers with stable purchasing activity over the past 12 months). This enables users to distinguish genuine buyers from low-quality leads and improve conversion efficiency in aluminum trade.
Category
Leave Message for Demo Request or Questions



















