
 Tendata AI
  Exhibition
 B2B Platforms
 Standalone Website
 Social Media
 Emails
 Import News
 2026-04-09
I. Overview of Total Import Stuff from China in 2025
The year 2025 marked a pivotal period for businesses seeking to import stuff from China, as the nation maintained its position as the world's leading manufacturing and export powerhouse despite evolving geopolitical dynamics. Total Chinese exports reached approximately $3.8 trillion USD in 2025, representing a 5.2% year-over-year increase, with major importing countries including the United States, European Union, ASEAN nations, and emerging markets continuing to rely heavily on Chinese manufacturing capacity。
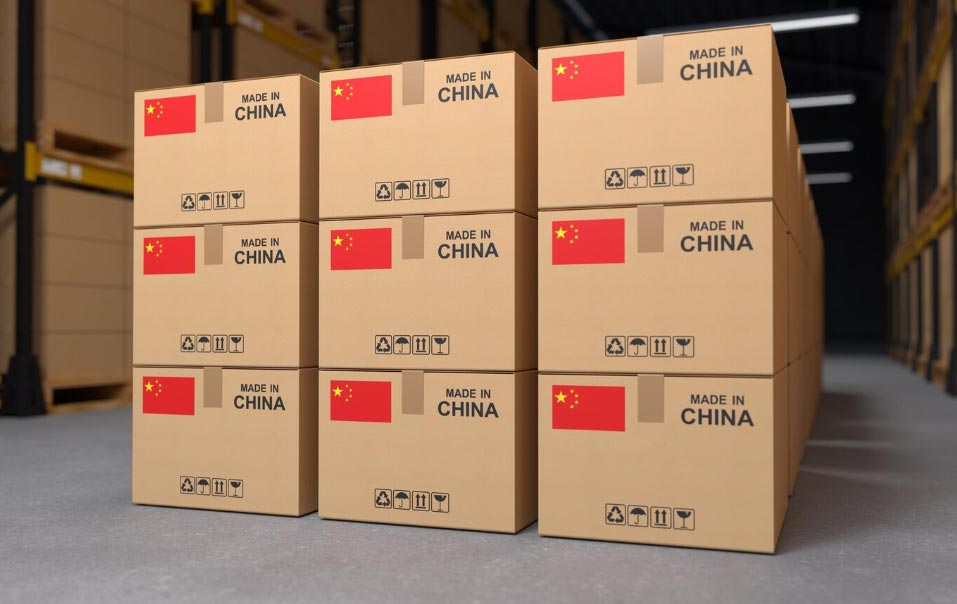
II. Major Import Products in 2025
The 2025 data on import stuff from China demonstrates a maturing trade relationship characterized by strategic selectivity rather than blanket dependency. While traditional low-value categories like textiles face decline, high-value sectors—electronics, renewable energy, medical devices, and EV components—continue to drive robust growth. For businesses importing stuff from China, success in 2025 and beyond requires a nuanced approach: leveraging China's unparalleled manufacturing capabilities in technology and advanced industries while diversifying risk through multi-country sourcing strategies. The data suggests that importing stuff from China remains essential for global supply chains, but the optimal strategy involves careful category selection, compliance investment, and strategic diversification to balance cost advantages with supply chain resilience. Companies that align their China import portfolios with high-growth, high-value categories while managing geopolitical and tariff risks will be best positioned to capitalize on continued opportunities in the world's second-largest economy.
Import Value Share by Category:>>Get More China Import Data via Tendata
Product Category | Import Value Share (Approx.) | 2025 Import Value (USD Billion) | Growth Trend | Key Drivers/Challenges |
Electronics & Consumer Technology | ~28-32% | ~$180-210 | Growing (+5-8%) | Smartphones, laptops, tablets, wearables; 5G devices; AI hardware |
Machinery & Industrial Equipment | ~15-18% | ~$95-120 | Stable (+2-4%) | Manufacturing machinery, pumps, motors, industrial components |
Textiles & Apparel | ~12-15% | ~$75-95 | Declining (-3% to -5%) | Tariff pressures; diversification to Vietnam, Bangladesh, India |
Furniture & Home Goods | ~10-12% | ~$65-80 | Stable (+1-3%) | Household furniture, lighting, kitchenware, home decor |
Toys, Games & Sports Equipment | ~8-10% | ~$50-65 | Growing (+4-6%) | Children's toys, gaming accessories, fitness equipment |
Automotive Parts & Accessories | ~7-9% | ~$45-60 | Growing (+6-9%) | EV components, batteries, electronics, aftermarket parts |
Plastics & Rubber Products | ~5-7% | ~$35-45 | Stable (+2-3%) | Packaging materials, industrial components, consumer products |
Medical Devices & Equipment | ~4-6% | ~$25-40 | Rapidly Growing (+10-15%) | PPE, diagnostic equipment, hospital supplies, medical consumables |
Lighting & Electrical Products | ~4-5% | ~$25-35 | Stable (+3-4%) | LED lighting, electrical components, wiring, switches |
Chemical Products | ~3-5% | ~$20-30 | Stable (+2-3%) | Industrial chemicals, specialty compounds, processing materials |
Bicycles & E-Bikes | ~2-4% | ~$15-25 | Rapidly Growing (+15-20%) | Fastest-growing category; urban mobility; green transportation |
Solar Panels & Renewable Energy | ~2-4% | ~$15-25 | Rapidly Growing (+18-25%) | High-growth sector; global clean energy transition |
Other Categories | ~5-8% | ~$35-50 | Stable (+2-4%) | Diversified portfolio including paper products, ceramics, etc. |
Data Source: Tendata Platform
· Rapidly Growing Categories:
The most dynamic growth in importing stuff from China occurred in technology and green energy sectors. Solar panels and renewable energy equipment experienced exceptional growth of 18-25%, driven by global climate commitments and accelerating clean energy transitions across North America and Europe.
E-bikes and bicycles emerged as the fastest-growing consumer category (+15-20%), reflecting urban mobility trends, sustainability preferences, and China's manufacturing dominance in electric vehicle technology.
Medical devices and equipment grew 10-15%, capitalizing on continued healthcare infrastructure investment and China's expanded manufacturing capabilities in medical consumables and diagnostic equipment following pandemic-era capacity expansions.
Automotive parts and accessories, particularly EV components and batteries, grew 6-9%, positioning China as a critical supplier in the global electric vehicle supply chain despite geopolitical tensions.
· Declining Categories:
Textiles and apparel experienced a structural decline of 3-5%, as importers diversified sourcing to Vietnam, Bangladesh, India, and other Southeast Asian nations to mitigate tariff risks and reduce supply chain concentration. This trend reflects a broader strategic shift in importing stuff from China away from labor-intensive, low-margin products.
III. Major Import Destinations in 2025
The 2025 data on global destinations when businesses import stuff from China reveals a trade landscape undergoing profound geographic realignment, characterized by three dominant trends:
· Traditional Markets Under Pressure:The United States, while remaining the single largest destination for those who imports stuff from China (~$421-425 billion, 11.1% market share), experienced a notable 5-8% decline in 2025.
· Southeast Asian Surge:Vietnam emerged as the fastest-growing major destination (+15-18% growth, ~$198-200 billion), capturing massive manufacturing capacity relocating from China. ASEAN collectively became the fastest-growing regional bloc (+12-15% growth, ~$550-580 billion, 14-15% market share),Thailand, Malaysia, and Indonesia all recorded double-digit growth rates (7-12%)。
·Emerging Market Expansion:Beyond Southeast Asia, several emerging markets including India, Russia, Middle East, Africa, and Brazil demonstrated exceptional growth for businesses that imports stuff from China.
Market Share by Country:>>Get More China Import Data via Tendata
Country/Region | Import Value from China (USD Billion) | Market Share of China's Total Exports | 2025 Growth Trend | Key Import Categories | Strategic Notes |
United States | ~$421-425 | ~11.1% | Declining (-5% to -8%) | Electronics, Consumer Goods, Machinery, Textiles, Toys | Largest single destination; tariff pressures; trade redirection occurring |
Hong Kong | ~$337-340 | ~8.9% | Stable (+1-2%) | Electronics, Precious Metals, Machinery, Re-exports | Major re-export hub to Southeast Asia and global markets |
Vietnam | ~$198-200 | ~5.3% | Rapidly Growing (+15-18%) | Electronics Components, Textiles, Machinery, Steel | Fastest-growing major partner; supply chain relocation hub |
Japan | ~$157-160 | ~4.2% | Stable (+2-3%) | Electronics, Chemicals, Textiles, Food Products | Mature relationship; technology and consumer goods focus |
South Korea | ~$145-150 | ~3.8% | Stable (+3-4%) | Semiconductors, Electronics, Chemicals, Machinery | Regional supply chain integration; tech components |
Germany | ~$135-140 | ~3.6% | Stable (+2-3%) | Electronics, Machinery, Consumer Goods, Textiles | Largest EU destination; industrial and consumer products |
India | ~$130-135 | ~3.4% | Growing (+8-10%) | Electronics, Machinery, Chemicals, Active Pharma Ingredients | Emerging market leader; manufacturing input demand |
United Kingdom | ~$115-120 | ~3.0% | Stable (+3-4%) | Consumer Electronics, Textiles, Machinery, Furniture | Post-Brexit trade patterns stabilized |
Mexico | ~$110-115 | ~2.9% | Rapidly Growing (+12-15%) | Electronics, Auto Parts, Machinery, Consumer Goods | Nearshoring to US; assembly and re-export hub |
Netherlands | ~$95-100 | ~2.5% | Stable (+2-3%) | Electronics, Machinery, Consumer Goods | European logistics and distribution hub |
Singapore | ~$90-95 | ~2.4% | Growing (+6-8%) | Electronics, Refined Petroleum, Machinery | Regional trade and finance hub |
Malaysia | ~$85-90 | ~2.2% | Growing (+7-9%) | Electronics, Semiconductors, Palm Oil, Machinery | Semiconductor supply chain integration |
Thailand | ~$80-85 | ~2.1% | Growing (+8-10%) | Electronics, Auto Parts, Machinery, Plastics | Manufacturing relocation destination |
Indonesia | ~$75-80 | ~2.0% | Rapidly Growing (+10-12%) | Electronics, Machinery, Steel, Consumer Goods | Emerging Southeast Asian star; large domestic market |
ASEAN (Collective) | ~$550-580 | ~14-15% | Rapidly Growing (+12-15%) | Diversified across all categories | Fastest-growing regional bloc; trade redirection beneficiary |
European Union (Collective) | ~$480-500 | ~12-13% | Stable (+3-4%) | Electronics, Machinery, Textiles, Consumer Goods | Stable demand; regulatory compliance focus |
Brazil | ~$55-60 | ~1.5% | Growing (+8-10%) | Electronics, Machinery, Chemicals, Consumer Goods | Latin America leader; infrastructure investment |
Russia | ~$110-115 | ~2.9% | Growing (+15-20%) | Vehicles, Electronics, Machinery, Consumer Goods | Sanctions-driven trade surge; alternative supplier |
Middle East (GCC) | ~$140-150 | ~3.7% | Growing (+10-12%) | Electronics, Machinery, Construction Materials, Consumer Goods | Infrastructure boom; diversification from oil |
Africa (Collective) | ~$120-130 | ~3.2% | Rapidly Growing (+15-18%) | Electronics, Textiles, Machinery, Infrastructure Materials | Fastest-growing emerging region; Belt and Road impact |
Other Countries | ~$650-700 | ~17-18% | Stable (+4-5%) | Diversified portfolio | Includes Latin America, Central Asia, Oceania |
Data Source: Tendata Platform
The 2025 data on global destinations when businesses import stuff from China illustrates a trade ecosystem in strategic transformation. While traditional markets like the United States face headwinds, emerging opportunities in Southeast Asia, Africa, India, and the Middle East are reshaping the geography of Chinese exports. For companies that imports stuff from China, success in 2025 and beyond will depend on agile supply chain strategies, diversified market portfolios, and the ability to capitalize on high-growth emerging markets while navigating complex regulatory and geopolitical landscapes. The redirection of approximately $150 billion in trade flows from the U.S. to alternative destinations underscores the dynamic and adaptive nature of global trade patterns in an era of economic uncertainty and strategic realignment.
IV. Trade Partners and Buyer Data in 2025
The 2025 data on importing stuff from China reveals a global trade ecosystem characterized by large, diversified importers navigating complex supply chain dynamics. While specific transaction-level records (exact amounts, frequencies, weights for individual buyer-seller relationships) remain confidential due to commercial privacy protections, the aggregate intelligence provides clear strategic insights:
Key Observations:
· Corporate Concentration: Global trade when importing stuff from China is heavily concentrated among dominant multinational corporations, particularly in technology (Apple, Dell), retail (Walmart, Amazon), automotive (Volkswagen, Tesla), and pharmaceuticals (Pfizer, Johnson & Johnson). These companies account for an estimated 50-60% of total imports from China.
· Geographic Diversification: The import stuff from China landscape shows active supply chain diversification, with many importers adopting a "China Plus One" strategy. Vietnam, India, and Mexico have gained significance as alternative or complementary sourcing locations, though China remains the primary supply base for most categories.
· Sectoral Divergence: High-value sectors—pharmaceuticals (+20% import growth), renewable energy (+25%), and electric vehicle components (+35%)—outperformed traditional manufacturing sectors like textiles and apparel (-4%), reflecting global shifts toward sustainability and technology.
· Regional Supply Clusters: Chinese supply chains remain highly regionalized, with Guangdong dominating electronics, Jiangsu leading in pharmaceuticals and machinery, and Zhejiang specializing in consumer goods and textiles. Importing stuff from China efficiently requires understanding these regional specializations.
Major Import Companies When Importing Stuff from China by Industry (2025):>>Get More China Import Data via Tendata
Industry Sector | Major Import Companies (By Country) | Primary Products Imported from China | Estimated Annual Import Value (USD) | Key Chinese Supply Regions | 2025 Trade Trend |
Technology & Electronics | Apple, Dell, HP, Microsoft, Samsung (US/KR) | Smartphones, Laptops, Components, Accessories | $50-100 Billion+ | Guangdong, Shenzhen, Jiangsu, Shanghai | Growing (+8-12%) AI hardware demand |
Retail & Consumer Goods | Walmart, Amazon, Target, Costco, IKEA (US/EU) | Furniture, Toys, Home Goods, Textiles, Electronics | $30-60 Billion+ | Zhejiang, Guangdong, Fujian, Jiangsu | Stable (+3-5%) |
Automotive | Volkswagen, BMW, Tesla, GM, Ford (DE/US) | Auto Parts, Electronics, Batteries, Components | $20-40 Billion+ | Shanghai, Jiangsu, Guangdong, Hubei | Growing (+10-15%) EV supply chain |
Pharmaceuticals & Medical | Pfizer, Johnson & Johnson, Roche, Novartis (US/EU) | Active Ingredients, Medical Devices, Packaging | $15-30 Billion+ | Jiangsu, Zhejiang, Shanghai, Shandong | Rapidly Growing (+15-20%) |
Industrial Machinery | Siemens, Bosch, Caterpillar, GE (DE/US) | Machinery Components, Motors, Control Systems | $15-25 Billion+ | Jiangsu, Shandong, Guangdong, Liaoning | Stable (+4-6%) |
Fashion & Apparel | Nike, Adidas, H&M, Zara, Uniqlo (US/EU) | Textiles, Garments, Footwear, Accessories | $20-35 Billion+ | Guangdong, Fujian, Zhejiang, Jiangsu | Declining (-3% to -5%) |
Home Appliances | Whirlpool, Electrolux, Haier (global ops) | Refrigerators, Washers, AC Units, Small Appliances | $10-20 Billion+ | Guangdong, Zhejiang, Jiangsu, Shandong | Stable (+2-4%) |
E-commerce & Logistics | Amazon, Alibaba (global), FedEx, DHL | Diversified Consumer Goods, Packaging, Equipment | $25-45 Billion+ | Multiple regions (nationwide) | Growing (+10-12%) |
Telecommunications | Cisco, Nokia, Ericsson, Huawei partners | Network Equipment, Cables, Components, 5G Tech | $10-18 Billion+ | Guangdong, Jiangsu, Beijing, Shanghai | Stable (+3-5%) |
Renewable Energy | First Solar, Vestas, Siemens Energy | Solar Panels, Wind Components, Batteries, Inverters | $12-22 Billion+ | Jiangsu, Zhejiang, Guangdong, Anhui | Rapidly Growing (+18-25%) |
Data Source: Tendata Platform
Industry-Level Overseas Buyer Patterns When Importing Stuff from China (2025 Aggregates):>>Get More China Import Data via Tendata
Industry | Top Importing Countries (By Value Share) | Top Chinese Supply Provinces | Avg. Shipment Frequency | Notable 2025 Shifts | |||
Technology & Electronics | USA (35%), EU (28%), Japan (12%), South Korea (10%) | Guangdong (40%), Jiangsu (25%), Shanghai (15%) | 30-50 shipments/month | Vietnam assembly +15%; direct China imports stable | |||
Retail & Consumer Goods | USA (40%), EU (30%), UK (10%), Australia (5%) | Zhejiang (30%), Guangdong (28%), Fujian (20%) | 50-80 shipments/month | E-commerce direct shipping +20% | |||
Automotive Parts | Germany (25%), USA (22%), Japan (15%), Mexico (12%) | Shanghai (25%), Jiangsu (22%), Guangdong (20%) | 25-45 shipments/month | EV battery components +35% | |||
Pharmaceuticals | USA (30%), EU (35%), India (15%), Japan (10%) | Jiangsu (35%), Zhejiang (25%), Shanghai (20%) | 15-30 shipments/month | API imports +22%; regulatory compliance focus | |||
Textiles & Apparel | USA (35%), EU (32%), Japan (12%), UK (8%) | Guangdong (30%), Fujian (25%), Zhejiang (22%) | 40-70 shipments/month | Overall -4%; premium segments stable | |||
Machinery & Equipment | USA (28%), Germany (20%), Japan (15%), India (12%) | Jiangsu (30%), Shandong (22%), Guangdong (18%) | 20-35 shipments/month | Industrial automation +8% | |||
Renewable Energy | USA (30%), EU (35%), India (15%), Australia (8%) | Jiangsu (35%), Zhejiang (25%), Guangdong (20%) | 15-25 shipments/month | Solar panels +28%; batteries +32% | |||
Home Appliances | USA (32%), EU (30%), Japan (15%), Middle East (10%) | Guangdong (35%), Zhejiang (25%), Shandong (18%) | 25-40 shipments/month | Smart appliances +12% | |||
Data Source: Tendata Platform
Sample Transaction Pattern Analysis When Importing Stuff from China (Industry Averages):>>Get More China Import Data via Tendata
Industry | Avg. Transaction Value (USD) | Avg. Transaction Frequency | Avg. Shipment Weight | Primary Transport Mode | Lead Time |
Technology & Electronics | $3-15 Million | 25-50 shipments/month | 10-40 Metric Tons | Air Freight (High-Value) | 7-14 days |
Retail & Consumer Goods | $1-8 Million | 40-80 shipments/month | 20-100 Metric Tons | Sea Freight (Containerized) | 25-35 days |
Automotive Parts | $5-20 Million | 20-40 shipments/month | 50-300 Metric Tons | Sea/Rail Freight | 20-30 days |
Pharmaceuticals | $2-10 Million | 15-30 shipments/month | 5-20 Metric Tons | Air Freight (Temperature-Controlled) | 5-10 days |
Textiles & Apparel | $0.5-5 Million | 35-65 shipments/month | 15-60 Metric Tons | Sea Freight (Containerized) | 20-30 days |
Machinery & Equipment | $5-25 Million | 15-30 shipments/month | 50-400 Metric Tons | Sea Freight (Specialized) | 30-45 days |
Renewable Energy | $10-50 Million | 10-25 shipments/month | 100-500 Metric Tons | Sea Freight (Bulk/Container) | 25-40 days |
Home Appliances | $2-12 Million | 20-40 shipments/month | 30-150 Metric Tons | Sea Freight (Containerized) | 25-35 days |
Data Source: Tendata Platform
The 2025 landscape of importing stuff from China demonstrates a mature, diversified global supply chain that continues to evolve despite geopolitical tensions and trade policy uncertainties. While granular transaction data remains protected, the available aggregate intelligence clearly indicates that import stuff from China activities remain robust across technology, healthcare, renewable energy, and consumer goods sectors.
V. Tendata and Its Brazil Data Sources and Reliability
Tendata provides comprehensive and reliable insights for businesses looking to import stuff from China by integrating multi-source trade data with advanced AI-driven analytics. Its China trade database is primarily built on authoritative sources such as General Administration of Customs of China, along with internationally recognized datasets like UN Comtrade. These sources collect data through mandatory customs declarations and standardized reporting systems, ensuring that information related to goods that imports stuff from China is accurate, consistent, and aligned with global statistical frameworks.
To enhance completeness and usability, Tendata further aggregates data from logistics providers, port authorities, and commercial shipment records. Through rigorous data cleaning, normalization, and cross-source validation, the platform delivers enriched datasets that include detailed fields such as HS codes, product descriptions, shipment values, quantities, origin ports, and destination markets—making analysis for companies that import stuff from China more actionable and precise.
In terms of reliability, China’s trade data is considered highly authoritative due to strict regulatory oversight and continuous verification processes, with frequent updates (typically monthly) ensuring timely visibility into market trends. For businesses seeking deeper insights, Tendata also offers advanced paid datasets with granular, shipment-level intelligence, including verified buyer and supplier identities, transaction pricing, trade frequency, and supply chain relationships. These premium capabilities enable users to better understand how companies imports stuff from China, identify real buyers and competitors, and develop data-driven sourcing and expansion strategies.
FAQ: China Import Data and Market Insights
1.Where can I find reliable data to support import stuff from China, and how can businesses better understand importing stuff from China to the United States?
Reliable insights for businesses looking to import stuff from China are primarily based on official customs and trade reporting systems. In the United States, import data is collected through mandatory customs declarations and Bills of Lading records managed by authorities such as U.S. Customs and Border Protection, ensuring that trade information is standardized, traceable, and legally verified. These records capture detailed shipment-level data—including product classifications (HS codes), values, origins, and logistics flows—making them a highly authoritative foundation for analyzing cross-border trade.
However, while official datasets provide strong macro-level visibility, companies engaged in importing stuff from China often face challenges such as fragmented data sources, complex customs procedures, and inconsistent supplier information. Importing from China to the U.S. is a highly regulated process involving tariffs, documentation, and compliance requirements, which makes accurate and integrated data essential for decision-making.
This is where platforms like Tendata enhance value by consolidating multiple data streams—including customs records, logistics data, and commercial shipment information—and applying advanced data cleaning and AI analysis. As a result, businesses can access shipment-level intelligence such as verified suppliers, transaction prices, and trade frequency.
By combining authoritative public data with enriched commercial insights, Tendata enables companies to move beyond basic statistics and gain a clearer, more actionable understanding of importing stuff from China, helping them identify real suppliers, reduce sourcing risks, and optimize their global procurement strategies.
Category
Leave Message for Demo Request or Questions



















