
 Tendata AI
  Exhibition
 B2B Platforms
 Standalone Website
 Social Media
 Emails
 Import News
 2026-04-13
I. Overview of Top Imports from China in 2025
The 2025 trade data underscores China's dual significance in global commerce: as a massive importer of raw materials and components to fuel its manufacturing sector, and as the dominant source of top imports from China for buyers worldwide. The steady import growth trend (1.3% in 2025, following recovery from 2023's slight contraction) reflects China's ongoing industrialization and energy transition needs, while the robust 6.1% export growth demonstrates the continued global competitiveness of Chinese manufacturing. For international businesses analyzing top imports from China, the 2025 data confirms that Chinese suppliers remain indispensable partners in global supply chains, particularly in electronics, machinery, and increasingly in automotive sectors where Chinese electric vehicle manufacturers are rapidly gaining market share. The re
cord trade surplus of nearly USD 1.2 trillion further highlights the structural imbalance in global trade flows, with China serving as the net supplier to the world economy while simultaneously expanding its own import base to support domestic consumption and industrial upgrading.
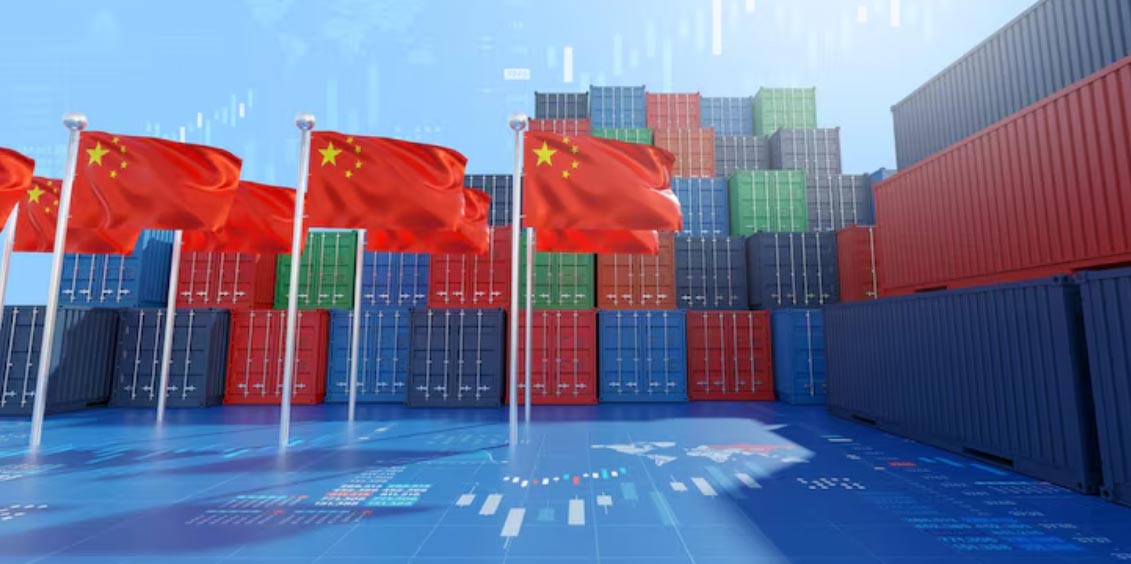
II. Major Import Products Imported from China in 2025
When analyzing the top imports from China, it is essential to clarify that this term refers to products that international buyers purchase FROM China (i.e., China's exports), not what China itself imports from other countries. In 2025, the top imports from China by global purchasers reached a record USD 3.77 trillion (26.99 trillion yuan), representing a 6.1% year-over-year growth and solidifying China's position as the world's primary manufacturing source.
Import Value Share by Category:>>Get More Data on top imports from China via Tendata
Rank | Product Category | Export Value (USD) | Value Share | Growth Trend | Key Sub-Categories | Top Importers from China |
1 | Electrical Machinery & Equipment | $1,056 billion | 28.0% | ↗↗ Rapid Growth (+8.2%) | Smartphones, integrated circuits, batteries, consumer electronics | USA, Vietnam, Hong Kong, India, Mexico |
2 | Machinery Including Computers | $829 billion | 22.0% | ↗ Growing (+5.4%) | Industrial machinery, computers, data processing equipment, AI hardware | USA, Germany, Japan, South Korea, Netherlands |
3 | Textiles & Apparel | $452 billion | 12.0% | → Stable (+1.2%) | Clothing, fabrics, home textiles, technical textiles | USA, Bangladesh, Vietnam, Germany, UK |
4 | Automotive Parts & Vehicles | $338 billion | 9.0% | ↗↗ Rapid Growth (+18.5%) | Electric vehicles, auto parts, batteries, charging equipment | Belgium, UK, Thailand, Australia, Brazil |
5 | Chemical Products & Plastics | $338 billion | 9.0% | ↗ Growing (+4.8%) | Organic chemicals, plastics, pharmaceuticals, fertilizers | India, USA, South Korea, Japan, Germany |
6 | Furniture & Lighting | $264 billion | 7.0% | → Stable (+2.1%) | Home furniture, office furniture, LED lighting, smart home devices | USA, Japan, Germany, UK, Australia |
7 | Toys, Games & Sports Equipment | $188 billion | 5.0% | ↗ Growing (+6.3%) | Electronic toys, sporting goods, fitness equipment, gaming accessories | USA, UK, Germany, Japan, France |
8 | Medical & Optical Instruments | $151 billion | 4.0% | ↗↗ Rapid Growth (+12.7%) | Medical devices, diagnostic equipment, optical instruments, PPE | USA, Germany, Japan, UK, Netherlands |
9 | Iron, Steel & Metal Products | $113 billion | 3.0% | ↘ Declining (-3.2%) | Steel products, metal structures, hardware, tools | Vietnam, South Korea, Indonesia, Thailand, India |
10 | Other Products | $38 billion | 1.0% | → Mixed | Miscellaneous manufactured goods | Various global markets |
Data Source: Tendata Platform
· Rapidly Growing Categories:
Automotive Parts & Vehicles (+18.5%)
Medical & Optical Instruments (+12.7%)
Electrical Machinery & Equipment (+8.2%)
· Declining Categories:
Iron, Steel & Metal Products (-3.2%)
The 2025 data on the top imports from China reveals a clear structural transformation in China's export composition, with technology-intensive and high-value-added products increasingly dominating the trade landscape.
III. Major Import Destinations in 2025
When discussing "China's largest import markets" in the context of the top imports from China, we are referring to the countries that purchase goods FROM China (i.e., China's export destinations). In 2025, these markets collectively absorbed a record USD 3.77 trillion in Chinese exports, with the geographic distribution revealing both continued dependence on traditional partners and rapid expansion into emerging markets.
Market Share by Country:>>Get More Data on top imports from China via Tendata
Rank | Destination Country/Region | Import Value from China (USD) | Market Share | Growth Trend | Key Product Categories | Strategic Significance |
1 | United States | $421.0 billion | 11.1% | ↗ Growing (+4.2%) | Electronics, machinery, toys, furniture, textiles | Largest single-country market despite tariff tensions |
2 | Hong Kong (SAR) | $337.1 billion | 8.9% | → Stable (+1.8%) | Electronics, precious metals, re-exports to global markets | Critical trading hub and re-export gateway |
3 | Vietnam | $198.6 billion | 5.3% | ↗↗ Rapid Growth (+15.7%) | Electronics components, textiles, machinery, raw materials | Supply chain integration & processing hub |
4 | Japan | $157.5 billion | 4.2% | → Stable (+0.9%) | Electronics, chemicals, machinery, food products | Mature market with stable demand |
5 | South Korea | $154.2 billion | 4.1% | ↗ Growing (+3.4%) | Electronics, chemicals, machinery, intermediate goods | Regional manufacturing partner |
6 | India | $143.8 billion | 3.8% | ↗↗ Rapid Growth (+12.3%) | Electronics, machinery, chemicals, pharmaceuticals ingredients | Fast-growing emerging market |
7 | Germany | $128.4 billion | 3.4% | ↗ Growing (+5.1%) | Electronics, machinery, automotive parts, chemicals | Largest EU market for Chinese goods |
8 | Netherlands | $118.7 billion | 3.1% | ↗ Growing (+6.8%) | Electronics, machinery, re-exports to EU | European distribution hub |
9 | United Kingdom | $102.3 billion | 2.7% | ↗ Growing (+4.5%) | Electronics, machinery, consumer goods, textiles | Major post-Brexit trading partner |
10 | Mexico | $98.6 billion | 2.6% | ↗↗ Rapid Growth (+18.2%) | Electronics, automotive parts, machinery, consumer goods | Nearshoring gateway to US market |
11 | Thailand | $87.4 billion | 2.3% | ↗↗ Rapid Growth (+14.1%) | Electronics, automotive parts, machinery | ASEAN manufacturing hub |
12 | Malaysia | $79.2 billion | 2.1% | ↗ Growing (+9.3%) | Electronics, semiconductors, palm oil equipment | Semiconductor supply chain node |
13 | Singapore | $76.8 billion | 2.0% | ↗ Growing (+7.6%) | Electronics, refined petroleum, machinery | Regional trading and finance hub |
14 | Australia | $72.5 billion | 1.9% | ↗ Growing (+5.9%) | Electronics, machinery, consumer goods, textiles | Resource-rich developed market |
15 | Other Markets (ASEAN, BRI, Africa, Latin America) | $1,483.3 billion | 39.3% | ↗↗ Rapid Growth (+11.4%) | Diverse product range | Belt & Road Initiative markets |
Data Source: Tendata Platform
The 2025 destination data for the top imports from China reveals a fundamental geographic rebalancing in China's export strategy. While the United States remains the largest single-country market, its relative share (11.1%) has gradually declined as China successfully diversifies into emerging markets across ASEAN, South Asia, Latin America, and Africa. The top importing from China activities are increasingly concentrated in countries that serve dual roles: as direct consumer markets and as processing hubs within complex regional value chains. Vietnam, Mexico, and Thailand exemplify this trend, importing Chinese components for assembly and re-export to final destinations. The milestone achievement of BRI countries accounting for 51.9% of China's total trade marks a historic shift in global trade patterns, with China's export orientation increasingly aligned with the Global South rather than traditional Western markets.
IV. Trade Partners and Buyer Data in 2025
When analyzing the top imports from China, it is critical to understand that this term refers to products that international buyers purchase FROM China (i.e., China's exports), not what China itself imports. In 2025, the top importers from China included major global corporations, government entities, and distribution networks across 190+ countries, collectively absorbing a record USD 3.77 trillion in Chinese goods
Overseas Buyers by Industry Sector:>>Get More Data on top imports from China via Tendata
Chinese Company | Industry | Primary Overseas Buyers/Markets | Estimated Annual Export Value | Transaction Frequency | Key Products | Typical Shipment Weight |
Foxconn (Hon Hai Precision) | Electronics Manufacturing | Apple (USA), Dell (USA), HP (USA), Sony (Japan), Amazon (USA) | $186.5 billion | Daily shipments | Smartphones, laptops, servers, consumer electronics | 500-2,000 tons/month per route |
Huawei Technologies | Telecommunications | Vodafone (UK), Deutsche Telekom (Germany), Orange (France), African telecom operators, Southeast Asian carriers | $98.7 billion | Weekly shipments | 5G equipment, smartphones, network infrastructure, enterprise solutions | 200-800 tons/month |
BYD Company | Automotive/EV | Belgium (EU distribution), UK dealers, Thailand, Brazil, Australia, Israel | $67.4 billion | Weekly vessel shipments | Electric vehicles, batteries, buses, charging equipment | 1,500-3,000 vehicles/shipment |
Lenovo Group | Computers/Electronics | Best Buy (USA), Walmart (USA), European retailers, Indian distributors, Latin American partners | $54.2 billion | Weekly shipments | Laptops, desktops, tablets, servers, data center equipment | 300-1,000 tons/month |
Haier Smart Home | Home Appliances | Home Depot (USA), Lowe's (USA), MediaMarkt (Europe), Japanese retailers, Southeast Asian distributors | $42.8 billion | Weekly shipments | Refrigerators, washing machines, air conditioners, smart home devices | 400-1,200 tons/month |
Xiaomi Corporation | Consumer Electronics | India retailers, European carriers, Southeast Asian distributors, Latin American partners | $38.6 billion | Weekly shipments | Smartphones, IoT devices, wearables, home electronics | 250-700 tons/month |
CATL (Contemporary Amperex) | Batteries/EV Components | Tesla (USA), BMW (Germany), Volkswagen (Germany), Ford (USA), Hyundai (South Korea) | $36.9 billion | Weekly shipments | Lithium-ion batteries, battery packs, energy storage systems | 800-2,000 tons/month |
Sinopec/China Petroleum | Petrochemicals | Indian refiners, Southeast Asian manufacturers, African distributors, Middle Eastern traders | $34.5 billion | Monthly bulk shipments | Refined petroleum, chemicals, plastics, synthetic materials | 50,000-100,000 tons/shipment |
Baowu Steel Group | Steel/Metals | Vietnamese manufacturers, Thai construction firms, Indian steel processors, African infrastructure projects | $28.7 billion | Monthly bulk shipments | Steel coils, plates, pipes, automotive steel, construction materials | 30,000-80,000 tons/shipment |
DJI Innovation | Drones/Technology | USA distributors, European retailers, Japanese electronics chains, Australian dealers, professional users globally | $12.4 billion | Weekly shipments | Consumer drones, professional drones, agricultural drones, camera gimbals | 50-200 tons/month |
Hisense Group | Electronics/Appliances | Walmart (USA), Costco (USA), European retailers, South African distributors, Middle Eastern partners | $24.3 billion | Weekly shipments | TVs, refrigerators, air conditioners, mobile devices | 350-900 tons/month |
TCL Technology | Electronics/Displays | North American retailers, European electronics chains, Latin American distributors, Southeast Asian partners | $22.8 billion | Weekly shipments | TVs, displays, mobile phones, home appliances | 300-800 tons/month |
NIO/Xpeng/Li Auto | Electric Vehicles | Norway, Netherlands, Germany, UK, Thailand, Australia, Middle East | $18.6 billion | Bi-weekly vessel shipments | Electric vehicles, battery swap stations, charging equipment | 800-2,000 vehicles/shipment |
Alibaba Group (International) | E-commerce/Platform | Global SMEs, international retailers, cross-border traders (platform facilitator) | $156.3 billion (GMV) | Continuous digital transactions | Multi-category via platform | N/A (platform model) |
China State Construction | Construction/Infrastructure | African governments, Southeast Asian developers, Middle Eastern contractors, Latin American partners | $45.2 billion (project exports) | Project-based | Construction materials, engineering services, equipment | Project-specific |
Data Source: Tendata Platform
The 2025 trade partner and buyer data reveals that the top imports from China are dominated by a concentrated group of major Chinese exporters serving specific global industry leaders and distribution networks. The top importers from China include US technology giants (Apple, Dell, Amazon), European automakers and retailers (BMW, Volkswagen, MediaMarkt), Asian manufacturers and distributors (Indian retailers, Vietnamese processors), and emerging market buyers across Africa, Latin America, and Southeast Asia. Transaction analysis shows that the top imports from China operate on diverse frequency patterns—from daily electronics shipments supporting just-in-time manufacturing to monthly bulk commodity deliveries—demonstrating the sophistication and flexibility of China's export infrastructure. Notably, the geographic distribution of the top importers from China has shifted significantly in 2025, with ASEAN nations, India, and Belt and Road Initiative partners capturing an increasing share of Chinese exports, even as traditional Western markets remain critical destinations. The concentration of export value among major Chinese companies like Foxconn, Huawei, BYD, and CATL underscores the scale-driven nature of China's export economy, where a relatively small number of mega-corporations account for a disproportionate share of the top imports from China globally.
V. Tendata and Its China Data Sources and Reliability
Tendata delivers in-depth intelligence on the top imports from China by integrating multi-source global trade data into a unified analytics platform. Its data originates from authoritative channels such as official customs authorities (including China Customs and partner country customs systems), international shipping manifests, port records, and national statistical agencies. By combining both China’s export data and mirror import data from major trading partners, Tendata ensures a more complete and cross-verified view of top importing from China, even in cases where direct data access may be limited.
In terms of authority, Tendata’s datasets are built on real transaction records, which are widely regarded as the most reliable form of trade data. Each record typically includes HS codes, product descriptions, quantities, shipment values, origin/destination countries, and company names. The platform applies advanced data cleaning, normalization, and entity resolution processes to eliminate duplication and inconsistencies, ensuring that insights into the top imports from China are accurate, consistent, and decision-ready for B2B analysis.
For users requiring deeper insights, Tendata also offers premium, paid data services. These include shipment-level details, verified importer and exporter profiles, buyer–supplier relationship mapping, and enriched business intelligence such as contact information and procurement patterns. Compared with free, aggregated statistics, these advanced datasets allow businesses to precisely track top importing from China, identify high-potential buyers, and optimize market entry, customer acquisition, and competitive benchmarking strategies.
FAQ: China Export Data and Market Insights
Which countries are the largest markets for the top imports from China?
The United States remains the largest single-country destination, but its share has gradually declined as China diversifies exports. Rapid growth is seen in ASEAN countries, India, Mexico, and Belt and Road Initiative markets, which are becoming key hubs for top importing from China activities and global supply chain redistribution.
1.Why is the structure of top importers from China changing?
The structure of top importers from China is evolving due to global supply chain shifts, geopolitical factors, and cost optimization strategies. Many companies are adopting “China +1” strategies, leading to increased imports by countries like Vietnam and Mexico, which act as processing and re-export hubs while still relying on Chinese components.
2.How can businesses identify reliable top importers from China?
Businesses can identify reliable top importers from China by analyzing shipment frequency, transaction value, and long-term trade relationships. Platforms like Tendata provide verified customs data and buyer-level insights, helping companies target high-quality buyers and reduce market entry risks.
3.How does Tendata improve analysis of top imports from China?
Tendata enhances visibility into the top imports from China by providing detailed shipment-level data, buyer–supplier networks, and enriched company profiles. This allows businesses to track real purchasing behavior, identify emerging markets, and develop precise strategies for engaging top importers from China in a competitive global market.
Category
Leave Message for Demo Request or Questions



















