Tendata AI
  Exhibition
 B2B Platforms
 Standalone Website
 Social Media
 Emails
 Import News
 2026-07-10
Global demand for imported fertilizers reached approximately US$112.9 billion in 2025, reflecting the essential role of fertilizers in supporting agricultural production worldwide.
Compared with US$98.1 billion in 2021, global fertilizer import spending increased by 15.1% over the five-year period. On a year-over-year basis, the value of imported fertilizers rose by 17.7% from US$96 billion in 2024.
Global Fertilizer Import Market Overview
The international fertilizer import market is led by several major agricultural economies. The five largest fertilizer importers in 2025 were Brazil, India, the United States, mainland China, and Australia. Combined, these countries accounted for 41.6% of global fertilizer import expenditure.
From a regional perspective, Asia represented the largest destination market for imported fertilizers in 2025, with purchases valued at US$38.6 billion, equal to 34.2% of global fertilizer imports.
The regional distribution of fertilizer imports was as follows:
· Asia — 34.2%
· Europe — 22%
· Latin America and the Caribbean (excluding Mexico) — 20.9%
· North America — 12.4%
· Africa — 6.8%
· Oceania — 3.6%
· Australia, New Zealand, and Papua New Guinea were the major fertilizer buyers in the Oceania region.
For international trade classification, fertilizers are categorized under the HS Code 31, which covers mineral and chemical fertilizers as well as related fertilizer products.

Fertilizer Imports by Product Category
Nitrogen-based fertilizers remained the dominant category in global fertilizer imports, accounting for 75.2% of total imported fertilizer value in 2025.
Other fertilizer categories included:
· Potassic fertilizers — 19.4%
· Phosphatic fertilizers — 4.0%
· Animal or vegetable fertilizers — 1.3%
These figures highlight the continued importance of nitrogen fertilizers in supporting crop production and agricultural supply chains worldwide.
Top Fertilizer Importing Countries
The following countries recorded the highest import values for fertilizers in 2025:
1. Brazil — US$15.5 billion (13.7% of total fertilizer imports)
2. India — US$14.3 billion (12.6%)
3. United States — US$9 billion (8.0%)
4. Mainland China — US$4.9 billion (4.3%)
5. Australia — US$3.3 billion (2.9%)
6. France — US$3.24 billion (2.9%)
7. Thailand — US$2.9 billion (2.6%)
8. Canada — US$2.7 billion (2.4%)
9. Indonesia — US$2.5 billion (2.2%)
10. Mexico — US$2.27 billion (2.0%)
11. Bangladesh — US$2.19 billion (1.9%)
12. Poland — US$2.15 billion (1.9%)
13. Germany — US$2.06 billion (1.8%)
14. Argentina — US$2.06 billion (1.8%)
15. Türkiye — US$2 billion (1.8%)
Together, these 15 leading markets represented 62.9% of global fertilizer imports in 2025, demonstrating the concentration of fertilizer demand among major agricultural and industrial economies.
Fastest-Growing Fertilizer Import Markets
Among the leading fertilizer importers, several countries recorded strong growth from 2024 to 2025.
The fastest-growing fertilizer import markets were:
· India — +82.5%
· Argentina — +33.5%
· Bangladesh — +31.7%
· Germany — +31.5%
Meanwhile, some major markets experienced declining fertilizer import spending:
· Mexico — -6.9%
· United States — -4.0%
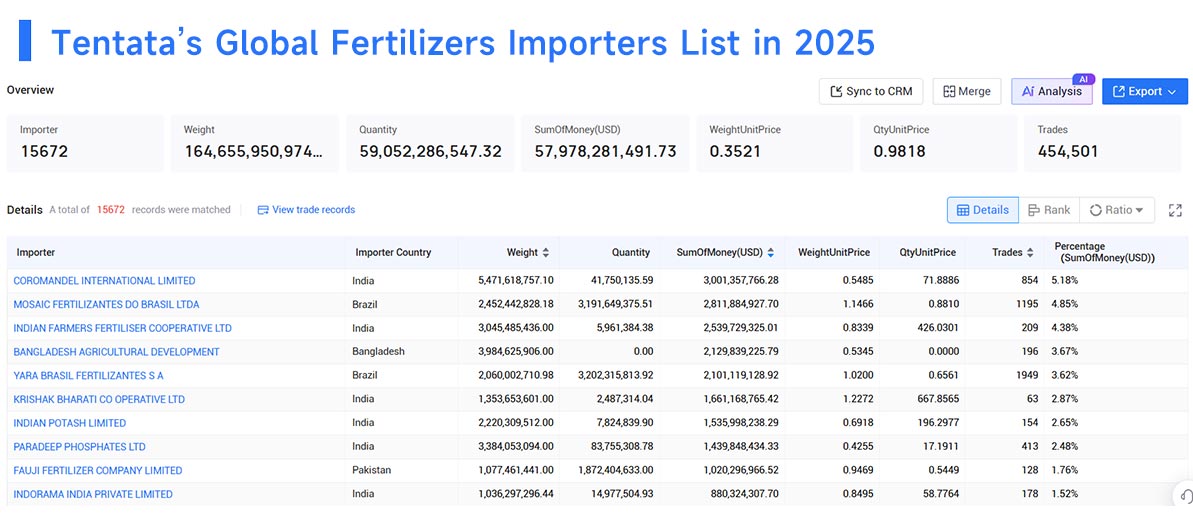
Top Fertilizer Import Companies
According to Tendata's Global Trade Intelligence Platform, the following companies were among the leading fertilizer importers in 2025:
1. COROMANDEL INTERNATIONAL LIMITED — 5.18% (US$3,001.36 million)
2. MOSAIC FERTILIZANTES DO BRASIL LTDA — 4.85% (US$2,811.88 million)
3. INDIAN FARMERS FERTILISER COOPERATIVE LTD — 4.38% (US$2,539.73 million)
4. BANGLADESH AGRICULTURAL DEVELOPMENT — 3.67% (US$2,129.84 million)
5. YARA BRASIL FERTILIZANTES S A — 3.62% (US$2,101.12 million)
6. KRISHAK BHARATI CO OPERATIVE LTD — 2.87% (US$1,661.17 million)
7. INDIAN POTASH LIMITED — 2.65% (US$1,536 million)
8. PARADEEP PHOSPHATES LTD — 2.48% (US$1,439.85 million)
9. FAUJI FERTILIZER COMPANY LIMITED — 1.76% (US$1,020.3 million)
10. INDORAMA INDIA PRIVATE LIMITED — 1.52% (US$880.32 million)
>>See More Fertilizers Importers with Tendata<<
With verified global trade records, Tendata enables businesses to analyze fertilizer import trends, identify major buyers, track shipment activities, and discover potential partners across the agricultural supply chain.
Category
Leave Message for Demo Request or Questions