Tendata AI
  Exhibition
 B2B Platforms
 Standalone Website
 Social Media
 Emails
 Export News
 2025-12-08
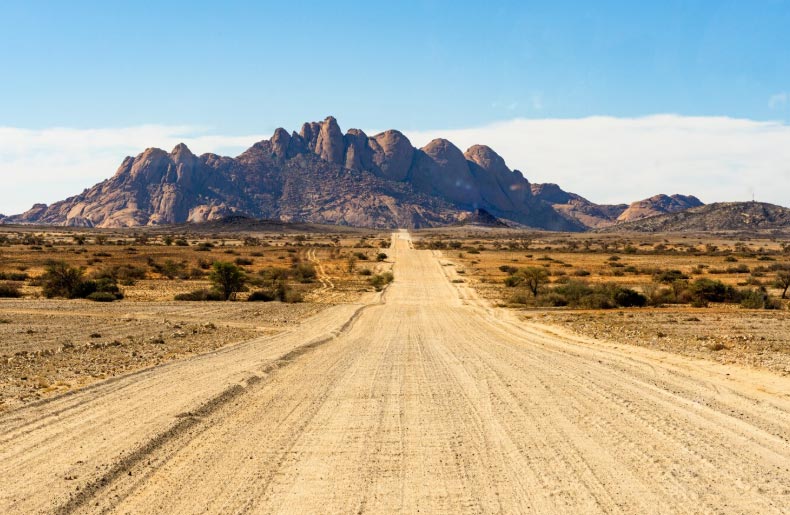
Situated on the southwest coast of Africa, Namibia recorded an estimated US$6.53 billion in global shipments for 2024. This performance highlights the steady growth of Namibia's export sector.
Compared with 2020's $5.42 billion, the 2024 figure reflects a 20.3% increase. Year-on-year growth was also strong, with Namibia's export value rising 14.5% from 2023's $5.7 billion.
Based on the average 2024 exchange rate, the Namibian dollar weakened by 10.6% against the US dollar since 2020, while appreciating 0.9% from 2023–2024. A softer currency relative to 2020 typically makes Namibia's export products more cost-competitive for global buyers paying in USD.
Namibia's Major Export Destinations
Recent statistics indicate that 87.5% of Namibia's export goods were shipped to the following markets:
1. South Africa (19%)
2. Mainland China (17%)
3. Botswana (15%)
4. Zambia (9.3%)
5. Belgium (5.2%)
6. Spain (4.7%)
7. Netherlands (3.4%)
8. Democratic Republic of the Congo (3.3%)
9. France (3%)
10. United Arab Emirates (2.9%)
11. United States (2.6%)
12. Canada (2.1%)
By continent, Africa accounted for 49.9% of Namibia's export value. Asia received 23.3%, Europe 21.5%, North America 4.8%, Latin America 0.3%, and Oceania 0.3%.
With a population of about 2.99 million, Namibia's $6.53 billion in 2024 exports equate to roughly $2,200 per person, up from $1,900 in 2023—yet another indicator of Namibia's export performance strengthening.
Namibia's Top 10 Export Categories
These were the highest-value categories within Namibia's export portfolio for 2024:
1. Gems and precious metals – US$1.8 billion (28.3%)
2. Ores, slag and ash – $1.5 billion (22.3%)
3. Fish – $781.1 million (12%)
4. Copper – $376.3 million (5.8%)
5. Mineral fuels including oil – $331 million (5.1%)
6. Machinery and computers – $189.5 million (2.9%)
7. Salt, sulphur, stone, cement – $164.7 million (2.5%)
8. Inorganic chemicals – $164.6 million (2.5%)
9. Live animals – $115 million (1.8%)
10. Meat – $98.2 million (1.5%)
These ten groups accounted for 84.6% of Namibia's export value.
The fastest-growing category was inorganic chemicals, up 820.3% from 2023. Machinery and computers followed with an 80.6% increase, while ores, slag and ash rose 56.5%. Gems and precious metals, however, declined by 7.5% year-on-year.
At the HS-4 level, leading items in Namibia's export structure included uranium ores (16.7%), unmounted diamonds (16.2%), unwrought gold (12%), copper alloys (5.6%), fish fillets (5.5%), frozen fish (5.5%), processed oils (4.8%), nickel ores (3.2%), cobalt oxides (1.8%) and grapes (1.3%).
Leading Namibian Export Companies
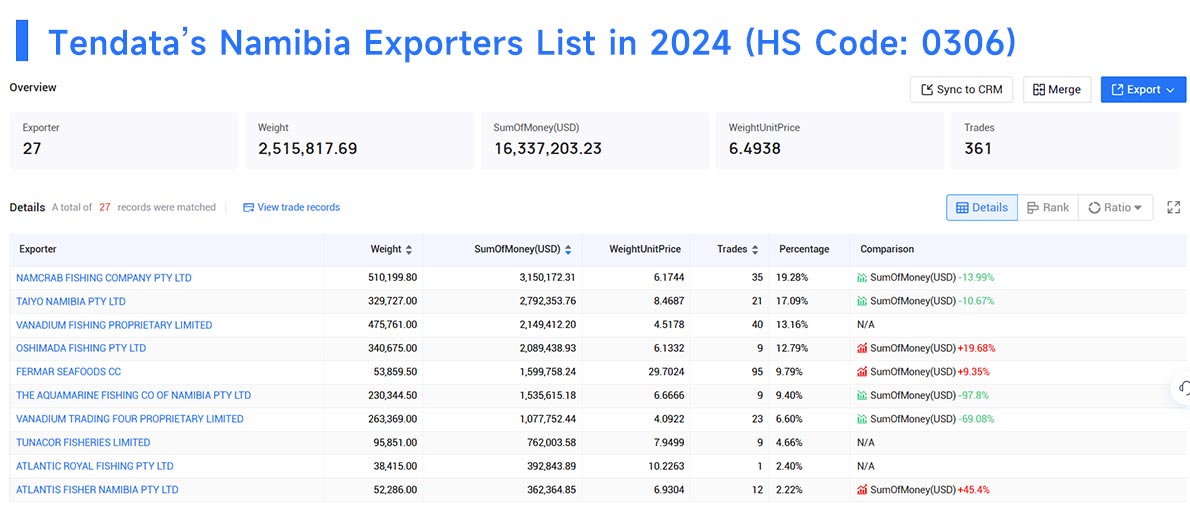
Using HS Code 0306 as an example, Tendata's trade-data platform shows the main contributors to Namibia's export supply in 2024:
1. NAMCRAB FISHING COMPANY PTY LTD – 19.28%
2. TAIYO NAMIBIA PTY LTD – 17.09%
3. VANADIUM FISHING PROPRIETARY LIMITED – 13.16%
4. OSHIMADA FISHING PTY LTD – 12.79%
5. FERMAR SEAFOODS CC – 9.79%
6. THE AQUAMARINE FISHING CO OF NAMIBIA PTY LTD – 9.4%
7. VANADIUM TRADING FOUR PROPRIETARY LIMITED – 6.6%
8. TUNACOR FISHERIES LIMITED – 4.66%
9. ATLANTIC ROYAL FISHING PTY LTD – 2.4%
10. ATLANTIS FISHER NAMIBIA PTY LTD – 2.22%
These companies represent a significant portion of Namibia's export activity in the seafood category.
>>Get A Free Demo<<
Category
Leave Message for Demo Request or Questions