Tendata AI
  Exhibition
 B2B Platforms
 Standalone Website
 Social Media
 Emails
 Export News
 2025-12-12
In 2024, Ecuador shipped goods valued at US$34.4 billion to global markets.
This figure represents a 70.2% jump from the $20.2 billion recorded in 2020.
Compared with 2023, when exports totaled $31.1 billion, Ecuador's export value rose by 10.6% year over year. The nation uses the US dollar as its official currency.
Among Ecuador's most important buyers, the United States, Panama, mainland China, the Netherlands, and Peru ranked as the top five destinations. Together, these countries were responsible for 60% of Ecuador's total export revenue in 2024.
From a regional perspective, 24.1% of Ecuador's export value went to Asia, while 30.3% was shipped to Latin American markets excluding Mexico but including the Caribbean. Another 22.5% was delivered to North American buyers.
Europe accounted for 22.1%, Africa for 0.8%, and Oceania—led by Australia and New Zealand—for 0.2%.
With a population of roughly 18 million, Ecuador's export total in 2024 translates to approximately $1,900 per person, the same per-capita export value recorded in 2023.

Leading Overseas Markets for Ecuador in 2024
Below is an overview of the top 25 destinations for Ecuadorian exports in 2024, along with each market's share of the country's total shipments:
1. United States: US$7 billion (20.4%)
2. Panama: $6.3 billion (18.3%)
3. Mainland China: $5.1 billion (14.8%)
4. Netherlands: $1.13 billion (3.3%)
5. Peru: $1.11 billion (3.2%)
6. Spain: $1 billion (2.9%)
7. Chile: $948.2 million (2.8%)
8. Russia: $898.3 million (2.6%)
9. Colombia: $850.3 million (2.5%)
10. Germany: $788.3 million (2.3%)
11. Italy: $746.7 million (2.2%)
12. Malaysia: $609.3 million (1.8%)
13. Belgium: $601 million (1.7%)
14. Indonesia: $481.8 million (1.4%)
15. Switzerland: $449.3 million (1.3%)
16. Mexico: $429 million (1.2%)
17. France: $420 million (1.2%)
18. Japan: $415.5 million (1.2%)
19. United Kingdom: $319.6 million (0.9%)
20. Canada: $294 million (0.9%)
21. Argentina: $278.4 million (0.8%)
22. United Arab Emirates: $260.6 million (0.8%)
23. Finland: $231.1 million (0.7%)
24. India: $216 million (0.6%)
25. Türkiye: $200.9 million (0.6%)
Collectively, these 25 trading partners absorbed 81.4% of Ecuador's global exports in 2024.
The most rapid growth in demand for Ecuadorian goods came from:
· Indonesia (+130.3% vs. 2023)
· Mexico (+110.8%)
· Belgium (+107.8%)
· Germany (+89.6%)
· Malaysia (+87.3%)
Meanwhile, notable declines occurred in shipments to:
· United Arab Emirates (–56.6%)
· India (–47.3%)
· Canada (–15.2%)
· Mainland China (–10.3%)
Finding Main Export Destinations for Ecuador
For companies aiming to expand into the Ecuadorean export market, identifying reliable Main Export Destinations is essential. With Tendata's advanced tools—such as keyword search and HS code filters—businesses can quickly pinpoint thousands of verified buyers, check purchasing trends, and access contact details, drastically cutting the time needed for market entry.
For example, when researching Banana demand, Tendata's platform can instantly reveal the top 10 Main Export Destinations for Ecuador for 2024. >>Find More Ecuador Trade Partners
1.United States(90.54%)
2.Peru(2.95%)
3.Brazil(1.7%)
4.Canada(1.21%)
5.Chile(1.03%)
6.Colombia(0.83%)
7.Panama(0.32%)
8.Nicaragua(0.32%)
9.Puerto Rico(0.31%)
10.Guatemala(0.17%, $0.02 Million)
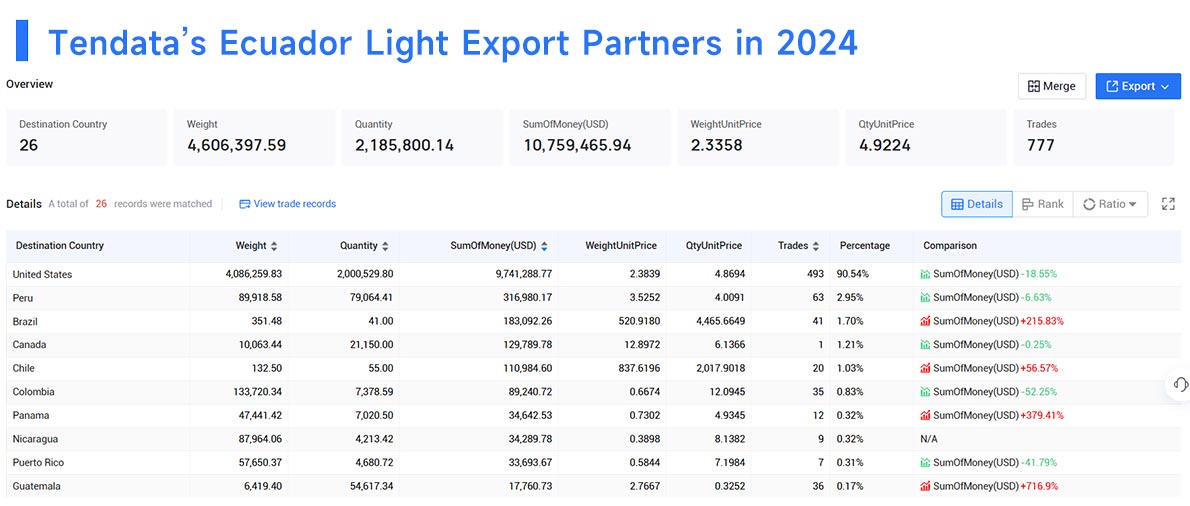
Whether you're a seasoned trader or a newcomer, using Ecuadorean export data can uncover valuable market opportunities. For more information on Ecuadorean export statistics or export data, contact Tendata for a free online demo.
Category
Leave Message for Demo Request or Questions