Tendata AI
  Exhibition
 B2B Platforms
 Standalone Website
 Social Media
 Emails
 Export News
 2025-12-12
In 2024, global bronze exports reached a combined value of US$569.9 million.
This figure represents a 72.2% increase over five years, compared with the $331 million recorded in 2020.
On a year-to-year basis, worldwide bronze exports grew by 9.8%, rising from $518.9 million in 2023.
Bronze is an alloy primarily created by mixing copper with tin, while smaller quantities of elements such as aluminum, lead, zinc, or silver may be incorporated depending on the product’s intended application.
Industrially, bronze is widely valued for its resistance to corrosion and is commonly used as a protective coating for iron or steel in galvanization. Its durability and stability in the presence of chemically treated or polluted water also make it a preferred material for fittings.
Less brittle than iron or tin yet stronger than pure copper, bronze plays an essential role in the production of valves, marine vessels, machinery components, coins, and artistic sculptures.
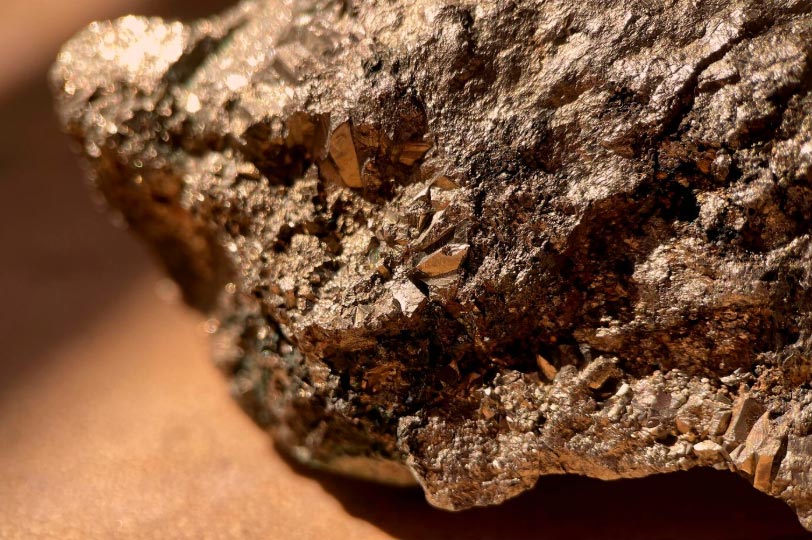
Geographic Highlights for Bronze Export Activity
By total export value, the top five bronze-exporting nations in 2024 were Spain, Japan, Germany, Italy, and Indonesia. Together, these countries accounted for 62.6% of global spending on bronze ores and concentrates.
Regionally, Europe dominated bronze export activity with shipments valued at $293.2 million, representing 51.5% of the global market.
Asia ranked second at 32.4%, followed by Latin America (excluding Mexico but including the Caribbean) with 10.3%, and North America with 4.2%.
Smaller shares were contributed by suppliers in Africa (1%) and Oceania (0.7%), particularly New Zealand, Australia, and Papua New Guinea.
For classification purposes, unwrought bronze—also known as copper-tin base alloy—is categorized under Harmonized System code 740322.
Top Bronze Exporters in 2024
Below are the 25 countries that achieved the highest bronze export values in 2024:
1. Spain: US$96.4M (16.9%)
2. Japan: $73.4M (12.9%)
3. Germany: $69.3M (12.2%)
4. Italy: $69.2M (12.1%)
5. Indonesia: $48.1M (8.4%)
6. Brazil: $45.4M (8%)
7. South Korea: $30.8M (5.4%)
8. Portugal: $22.7M (4%)
9. United States: $20.6M (3.6%)
10. Taiwan: $13M (2.3%)
11. Netherlands: $7.4M (1.3%)
12. France: $6.7M (1.2%)
13. India: $6.5M (1.1%)
14. United Kingdom: $5.7M (1%)
15. Türkiye: $5.7M (1%)
16. Ecuador: $5.6M (1%)
17. Paraguay: $4.2M (0.7%)
18. New Zealand: $3.8M (0.7%)
19. Canada: $3.2M (0.6%)
20. Saudi Arabia: $2.8M (0.5%)
21. Greece: $2.7M (0.5%)
22. Czech Republic: $2.4M (0.4%)
23. Singapore: $2.1M (0.4%)
24. Belarus: $1.9M (0.3%)
25. Norway: $1.5M (0.3%)
Together, these 25 nations were responsible for 96.1% of all bronze shipped internationally in 2024.
The most dramatic year-over-year growth came from:
· Paraguay (+715.3%)
· Saudi Arabia (+594.9%)
· Singapore (+194.3%)
· Czech Republic (+155.3%)
Meanwhile, the steepest export declines were seen in:
· India (–54.2%)
· United States (–38.3%)
· United Kingdom (–30.2%)
· Germany (–13.8%)
· Netherlands (–4.8%)
Bronze Industry Participants
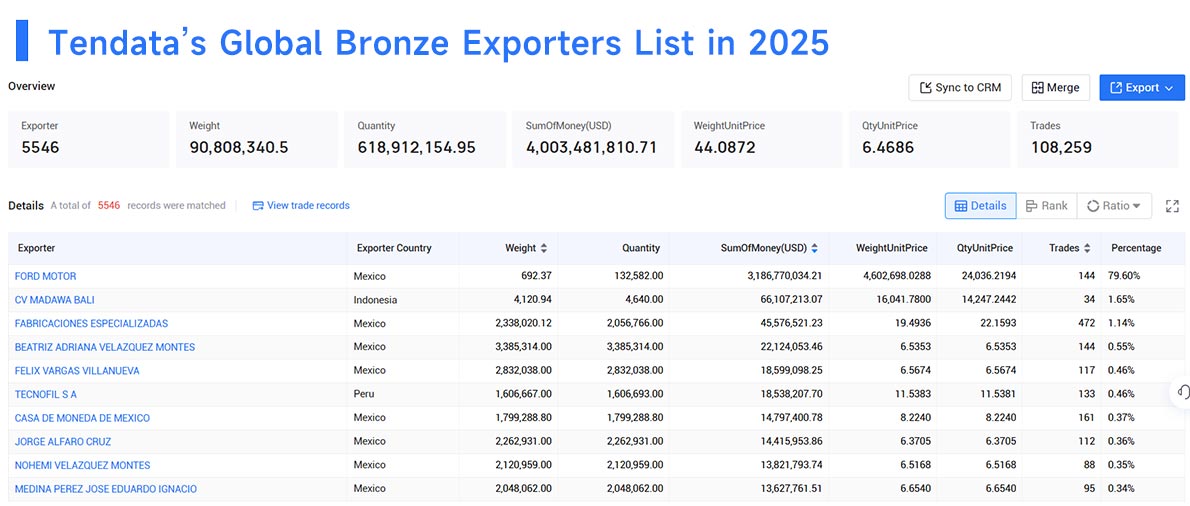
Below is a sample list of 10 established companies involved in producing, supplying, or brokering bronze on the global market based on Tendata Import Export Data:
1. FORD MOTOR (79.6%, $3186.77M)
2. CV MADAWA BALI (1.65%, $66.11M)
3. FABRICACIONES ESPECIALIZADAS (1.14%, $45.58M)
4. BEATRIZ ADRIANA VELAZQUEZ MONTES (0.55%, $22.12M)
5. FELIX VARGAS VILLANUEVA (0.46%, $18.6M)
6. TECNOFIL S A (0.46%, $18.54M)
7. CASA DE MONEDA DE MEXICO (0.37%, $14.8M)
8. JORGE ALFARO CRUZ (0.36%, $14.42M)
9. NOHEMI VELAZQUEZ MONTES (0.35%, $13.82M)
10. MEDINA PEREZ JOSE EDUARDO IGNACIO (0.34%, $13.63M)
>>Get A Free Demo with Tendata<<
Category
Leave Message for Demo Request or Questions