Tendata AI
  Exhibition
 B2B Platforms
 Standalone Website
 Social Media
 Emails
 Export News
 2026-01-29
Located in Northern Europe and sharing a southern border with Latvia, the Republic of Estonia exported goods worth US$19.8 billion to global markets in 2024.
This figure reflects a 17% increase compared to the US$16.9 billion recorded in 2020. However, on a year-to-year basis, Estonia's total export value experienced a -1.7% decline, down from US$20.1 billion in 2023.
Using the 2024 average exchange rate, Estonia operates with the euro, which strengthened slightly by 0.02% against the US dollar compared to 2023. This marginal appreciation of the euro made Estonian exports priced in US dollars slightly more expensive for overseas buyers.

Main Destinations of Estonian Exports
The most recent country-level trade data shows that 73.9% of Estonia's exports were absorbed by the following markets:
1. Finland (15.2%)
2. Latvia (10.7%)
3. Sweden (8.5%)
4. Lithuania (7.8%)
5. Germany (7.0%)
6. Russia (5.2%)
7. United States (4.0%)
8. Netherlands (3.7%)
9. Poland (3.5%)
10. Norway (3.1%)
11. Denmark (2.7%)
12. United Kingdom (2.3%)
From a regional perspective, Europe dominated Estonia's export structure, accounting for 85% of total export value, followed by Asia (8.5%) and North America (4.9%).
Smaller export shares were distributed to Africa (0.9%), Latin America and the Caribbean (0.5%), and Oceania (0.3%), primarily Australia and New Zealand.
As a member of the European Union since May 1, 2004, Estonia maintains strong intra-EU trade ties. Exports to EU countries represented 70.1% of Estonia's total exports.
With a population of approximately 1.371 million, Estonia's US$19.8 billion in exports in 2024 equals about US$14,400 per capita, which is lower than the US$16,800 per person recorded in 2023.
Estonia's Top Export Categories in 2024
The following product groups generated the highest export revenues for Estonia in 2024, along with their respective shares of total exports:
1. Electrical machinery and equipment – US$2.9 billion (14.8%)
2. Wood and wood products – US$2.1 billion (10.7%)
3. Machinery including computers – US$1.72 billion (8.7%)
4. Vehicles – US$1.68 billion (8.5%)
5. Mineral fuels, including oil – US$1.55 billion (7.8%)
6. Furniture, lighting, bedding, signage, prefabricated buildings – US$1.1 billion (5.5%)
7. Iron and steel articles – US$781.5 million (4.0%)
8. Optical, technical, and medical instruments – US$624.8 million (3.2%)
9. Plastics and plastic products – US$495.9 million (2.5%)
10. Animal and vegetable fats, oils, and waxes – US$479.9 million (2.4%)
Together, these ten sectors contributed approximately 68% of Estonia's total export value.
Among them, optical, technical, and medical equipment showed the strongest growth, rising 5.7% year-on-year.
Electrical machinery and equipment followed with a 4.4% increase, while wood exports grew modestly by 0.6%.
In contrast, notable declines were recorded in:
· Animal/vegetable fats, oils, and waxes (-13.3%)
· Mineral fuels and oil products (-12.7%)
· High-Value Export Products (HTS Level)
At the detailed four-digit Harmonized Tariff System (HTS) level, Estonia's most valuable export items include:
· Smartphones and telephone devices (5.8%)
· Passenger cars (4.5%)
· Wood carpentry and joinery products (2.1%)
· Prefabricated buildings (1.9%)
· Refined petroleum oils (1.9%)
· Fuel wood, wood chips, and sawdust (1.9%)
· High-temperature coal tar oils (1.8%)
· Electrical energy (1.6%)
· Palm oil (1.4%)
· Shaped wood products (1.4%)
Estonian Export Suppliers and Market Intelligence
For businesses seeking to enter or expand within the Estonian export market, supplier identification and verification are critical. Platforms like Tendata offer advanced tools such as keyword search, HS code filtering, buyer analysis, and trade trend tracking, enabling companies to efficiently locate verified suppliers, analyze procurement behavior, and access decision-maker contact information—significantly reducing market entry costs and time.
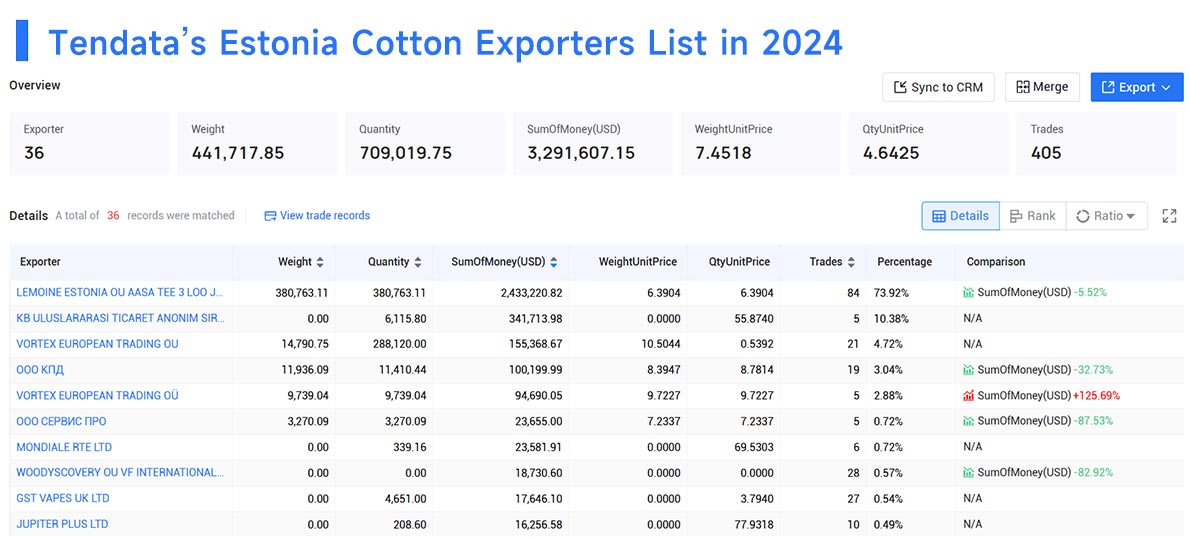
For instance, when analyzing cotton-related demand, Tendata can instantly generate a list of the top Estonian suppliers for 2024, including:
1. LEMOINE ESTONIA OU (73.92%)
2. KB ULUSLARARASI TICARET ANONIM SIRKET (10.38%)
3. VORTEX EUROPEAN TRADING OU (4.72%)
4. ООО КПД (3.04%)
5. VORTEX EUROPEAN TRADING OÜ (2.88%)
6. ООО СЕРВИС ПРО (0.72%)
7. MONDIALE RTE LTD (0.72%)
8. WOODYSCOVERY OU VF INTERNATIONAL SAGL (0.57%)
9. GST VAPES UK LTD (0.54%)
10. JUPITER PLUS LTD (0.49%)
Whether you are an experienced exporter or a new market entrant, leveraging Estonia's export data can reveal high-value trade opportunities, emerging demand trends, and strategic partnership potential.
To explore Estonian export statistics, supplier databases, and buyer intelligence tools, contact Tendata for a free online demo and unlock actionable global trade insights.
Category
Leave Message for Demo Request or Questions