Tendata AI
  Exhibition
 B2B Platforms
 Standalone Website
 Social Media
 Emails
 Export News
 2026-02-24
In 2025, Brazil generated approximately US$348.7 billion in Brazilian Exports, shipping products to more than 215 countries and territories worldwide. This performance further strengthened Brazil’s role as one of the leading exporters among emerging economies.
Compared with 2021, when overseas shipments totaled $280.8 billion, Brazilian Exports expanded by 24.2% over five years. On a year-over-year basis, the total value of Brazilian Exports rose 3.5%, increasing from $337 billion in 2024.
Brazil accounted for about 1.5% of total global exports in 2024, based on worldwide trade valued at $23.926 trillion. This share improved from 1.4% in the previous year, indicating steady growth in Brazilian Exports on the global stage.
More than half (50.7%) of Brazil's 2025 export revenue was concentrated among five key partners: China, United States, Argentina, Netherlands, and Spain.
Regional Breakdown of Brazilian Exports
Analyzing Brazilian Exports by region shows that 48.9% of total export value was directed toward Asian markets. European countries absorbed 17.1%, while North America accounted for 15.2%.
Additional destinations included Latin America and the Caribbean (14%, excluding Mexico), Africa (4.4%), and Oceania (0.4%), led by Australia, Marshall Islands, and New Zealand.
This diversified geographic distribution demonstrates the broad international reach of Brazilian Exports.
Top 25 Markets for Brazilian Exports
Below are 25 countries that imported the largest dollar value of Brazilian goods in 2025. Percentages indicate each country’s share of total Brazilian Exports:
1. China: US$100 billion (28.7%)
2. United States: $38 billion (10.9%)
3. Argentina: $18.1 billion (5.2%)
4. Netherlands: $11.7 billion (3.4%)
5. Spain: $8.8 billion (2.5%)
6. Mexico: $7.7 billion (2.2%)
7. Singapore: $7.4 billion (2.1%)
8. Canada: $7.3 billion (2.1%)
9. Chile: $7.2 billion (2.1%)
10. India: $6.9 billion (2%)
11. Germany: $6.5 billion (1.9%)
12. Japan: $5.51 billion (1.6%)
13. South Korea: $5.47 billion (1.6%)
14. Italy: $5.38 billion (1.5%)
15. Türkiye: $4.14 billion (1.2%)
16. Indonesia: $4.14 billion (1.2%)
17. United Kingdom: $4.04 billion (1.2%)
18. Belgium: $4.03 billion (1.2%)
19. Paraguay: $4.01 billion (1.2%)
20. United Arab Emirates: $3.78 billion (1.1%)
21. Vietnam: $3.76 billion (1.1%)
22. Egypt: $3.73 billion (1.1%)
23. Malaysia: $3.54 billion (1%)
24. Uruguay: $3.51 billion (1%)
25. Colombia: $3.4 billion (1%)
Together, these 25 destinations accounted for nearly 79.8% of total Brazilian Exports in 2025.
Fastest-Growing and Declining Export Destinations
Among Brazil’s leading buyers, Argentina (+31.4%), India (+30.2%), Uruguay (+29.5%), the United Kingdom (+28.8%), and Italy (+20.4%) recorded the strongest year-over-year growth in imports from Brazil.
Conversely, Brazilian Exports to Malaysia (-17.7%), the United Arab Emirates (-16.9%), Spain (-11.8%), Indonesia (-7.3%), and Vietnam (-7.3%) experienced the sharpest declines compared with 2024.
Companies Supporting Brazilian Exports
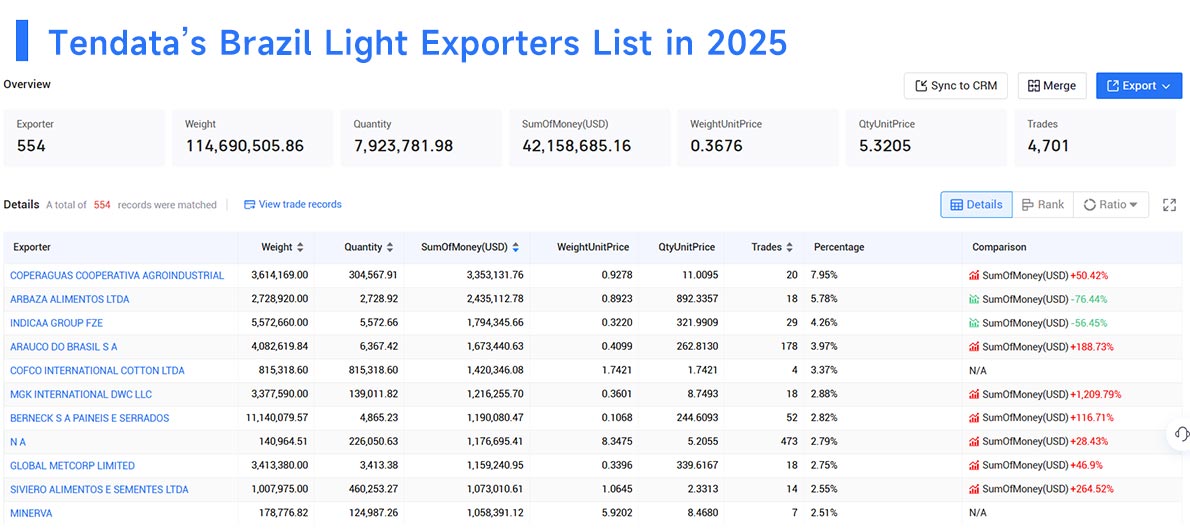
According to Tendata's supplier database, several companies play an active role in supporting Brazilian Exports to global trading partners. Examples include:
1. COPERAGUAS COOPERATIVA AGROINDUSTRIAL (7.95%, $3.35 million)
2. ARBAZA ALIMENTOS LTDA (5.78%, $2.44 million)
3. INDICAA GROUP FZE (4.26%, $1.79 million)
4. ARAUCO DO BRASIL S A (3.97%, $1.67 million)
5. COFCO INTERNATIONAL COTTON LTDA (3.37%, $1.42 million)
6. MGK INTERNATIONAL DWC LLC (2.88%, $1.22 million)
7. BERNECK S A PAINEIS E SERRADOS (2.82%, $1.19 million)
8. GLOBAL METCORP LIMITED (2.75%, $1.16 million)
9. SIVIERO ALIMENTOS E SEMENTES LTDA (2.55%, $1.07 million)
10. MINERVA (2.51%, $1.06 million)
>>Get A Free Demo<<
By analyzing Brazilian Exports data and understanding its core trading partners, businesses can identify high-potential markets, strengthen international cooperation, and uncover new global trade opportunities.
Category
Leave Message for Demo Request or Questions