Tendata AI
  Exhibition
 B2B Platforms
 Standalone Website
 Social Media
 Emails
 Export News
 2026-07-13
Situated between two of Asia's largest economies—China and India—the Federal Democratic Republic of Nepal exported goods valued at approximately US$2.4 billion in 2025.
Compared with 2021, when Nepal's exports totaled $1.67 billion, the country's overseas shipments expanded by 43.1% over the five-year period.
On an annual basis, export revenue surged 74.3%, climbing from $1.37 billion in 2024 to $2.4 billion in 2025.
Based on the average exchange rate for 2025, the Nepalese rupee appreciated 15.2% against the US dollar compared with 2021 and gained another 3.9% year over year. A stronger domestic currency generally makes Nepalese exports relatively more expensive for overseas buyers paying in US dollars.

Nepal's Main Export Markets
The latest country-level trade statistics (2022) indicate that 94.9% of Nepal's exports were destined for the following markets:
1. India (71.9%)
2. United States (11.3%)
3. Germany (2.5%)
4. Türkiye (2%)
5. United Kingdom (1.8%)
6. France (1%)
7. Australia (0.83%)
8. Japan (0.8%)
9. Canada (0.78%)
10. Italy (0.76%)
11. Netherlands (0.6%)
12. Denmark (0.55%)
From a regional perspective, Asia remained Nepal's largest export destination, receiving 77.5% of total exports by value. North America accounted for 12.1%, while Europe absorbed another 9.2%.
The remaining exports were distributed among Oceania (0.9%), mainly Australia and New Zealand, Africa (0.2%), and Latin America (0.1%), excluding Mexico but including Caribbean economies.
With a population of approximately 31.6 million, Nepal's exports in 2025 equated to roughly US$75 per person, compared with about US$41 per capita in 2024.
Nepal's Top 10 Export Categories
At the 2-digit Harmonized System (HS) level, the following product categories generated the highest export revenues for Nepal in 2025.
1. Animal or vegetable fats, oils and waxes: US$1.1 billion (47.7%)
2. Coffee, tea and spices: $104 million (4.4%)
3. Man-made staple fibers: $101.3 million (4.3%)
4. Textile floor coverings: $95.6 million (4%)
5. Mineral fuels and oils: $90.6 million (3.8%)
6. Wood and wood products: $70.1 million (2.9%)
7. Iron and steel: $69.4 million (2.9%)
8. Food industry residues and animal feed: $58.4 million (2.4%)
9. Beverages, spirits and vinegar: $57.9 million (2.4%)
10. Paper yarn and woven paper fabrics: $55.9 million (2.3%)
Combined, these 10 product groups represented approximately 77.2% of Nepal's total export value in 2025.
Among the leading export sectors, animal and vegetable fats, oils and waxes recorded the strongest year-over-year growth, soaring 631.9% compared with 2024.
The second-fastest growing category was paper yarn and woven paper fabrics, which increased 44.9%, followed by food industry waste and animal feed, up 17.8%.
By contrast, iron and steel experienced the largest decline among Nepal's major export categories, falling 32.5% year over year.
Nepal's Leading Export Products (4-Digit HS Level)
At the more detailed 4-digit HS code level, soybean oil remained Nepal's most valuable export, accounting for 42.5% of total export earnings.
Other major export products included:
1. Synthetic staple fiber yarn (3.9%)
2. Electrical energy (3.8%)
3. Knotted textile floor coverings and carpets (3.4%)
4. Sunflower, safflower and cottonseed oil (3.2%)
5. Nutmeg and cardamom (2.8%)
6. Non-alcoholic beverages excluding water (2.3%)
7. Woven jute fabrics (2.1%)
8. Flat-rolled iron or non-alloy steel products (2.1%)
9. Laminated wood (1.6%)
10. Palm oil (1.3%)
Together, the top products at the 4-digit HS level generated 67.7% of Nepal's total export value.
Nepal Exporters Database
Discover verified suppliers through Tendata's Nepal Exporters Database, built on authentic Nepal customs shipment records. Using Tendata Global Importers & Exporters Finder, buyers can quickly identify active exporters, analyze shipment histories, and connect directly with qualified suppliers.
Nepal Exporters Directory
Tendata provides comprehensive profiles for Nepalese exporters, including shipment records, export volumes, supply chain relationships, product descriptions, HS codes, and company contact information. These insights help importers evaluate potential business partners and source products with greater confidence.
Powered by verified Nepal export data, Tendata enables users to monitor trade activities, identify reliable suppliers, and explore business opportunities across a wide range of industries.
List of Nepal Exporters
Tendata's platform includes thousands of active exporters in Nepal. Each company profile contains key business information such as company name, product keywords, trading history, destination markets, and HS classifications, making supplier discovery faster and more efficient.
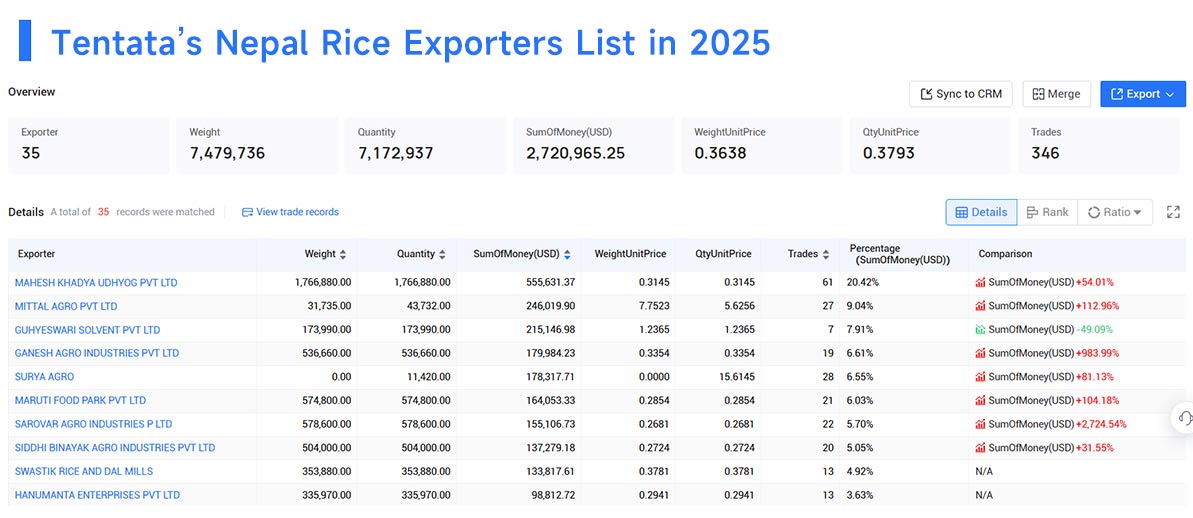
Taking rice exports as an example, Tendata identifies the following as some of Nepal's leading exporters in 2025:
1. MAHESH KHADYA UDHYOG PVT LTD (20.42%, US$0.56 Million)
2. MITTAL AGRO PVT LTD (9.04%, US$0.25 Million)
3. GUHYESWARI SOLVENT PVT LTD (7.91%, US$0.22 Million)
4. GANESH AGRO INDUSTRIES PVT LTD (6.61%, US$0.18 Million)
5. SURYA AGRO (6.55%, US$0.18 Million)
6. MARUTI FOOD PARK PVT LTD (6.03%, US$0.16 Million)
7. SAROVAR AGRO INDUSTRIES P LTD (5.7%, US$0.16 Million)
8. SIDDHI BINAYAK AGRO INDUSTRIES PVT LTD (5.05%, US$0.14 Million)
9. SWASTIK RICE AND DAL MILLS (4.92%, US$0.13 Million)
10. HANUMANTA ENTERPRISES PVT LTD (3.63%, US$0.10 Million)
Category
Leave Message for Demo Request or Questions