 Export News
 2025-08-13
Situated on the Indochina Peninsula in Southeast Asia, the Kingdom of Cambodia recorded exports valued at US$26.7 billion in 2024, reaching markets across the globe.
This figure marks a 50.5% surge from the $17.7 billion reported in 2020. On a year-over-year basis, Cambodian export earnings grew by 12.2% compared to $23.8 billion in 2023.
In 2024, the Cambodian riel appreciated by 7.3% against the US dollar over the past five years, and by 4.9% compared to 2023. This currency strength made goods priced in riel relatively more expensive for buyers using weaker US dollars.

Key Export Destinations
Recent trade data shows that 87.3% of Cambodia's exports were shipped to the following main destinations: the United States (37.2%), Vietnam (13.6%), China (6.6%), Japan (5.3%), Canada (4.2%), Spain (3.9%), United Kingdom (3.6%), Germany (3.4%), Thailand (3.2%), Netherlands (3%), Australia (1.8%), and France (1.5%).
By region, 42.2% of Cambodia's exports went to North America, while 34.4% went to buyers in Asia. European markets took 20.3% of shipments, with smaller amounts headed to Oceania (1.9%), Latin America (0.7%), and Africa (0.3%).
With a population of 17.2 million, Cambodia's 2024 exports equate to around $1,550 per person, up from $1,400 in 2023.
Cambodia's Top 10 Export Categories
The top export groups by value in 2024 were:
1.Knit or crochet clothing & accessories – $6.6 billion (24.9%)
2.Clothing & accessories (non-knit) – $3.2 billion (11.8%)
3.Leather goods – $2.1 billion (7.7%)
4.Cereals – $1.9 billion (7.3%)
5.Electrical machinery – $1.9 billion (7.1%)
6.Footwear – $1.7 billion (6.3%)
7.Rubber & rubber products – $1.5 billion (5.6%)
8.Furniture, bedding, lighting, prefabs – $1.2 billion (4.4%)
9.Fruits & nuts – $856.5 million (3.2%)
10.Vegetables – $692.6 million (2.6%)
These ten categories represented 80.9% of Cambodia's total exports.
Rubber products experienced the fastest growth at +58.6%, followed by non-knit clothing (+31.9%) and furniture/prefabricated buildings (+31.5%). Electrical machinery saw the sharpest decline at -39.9%.
Product Highlights (HS Code Level)
At the more detailed four-digit HS level, handbags, wallets, and cases were the single most valuable product (7.3% of total exports), followed by rice (7.1%), knitted pullovers (6.9%), non-knit women's clothing (4.9%), knit women's clothing (4.7%), new rubber tires (3.3%), solar diodes/semiconductors (3.1%), knitted t-shirts (2.8%), root crops like manioc and sweet potatoes (2.6%), and leather footwear (2.5%).
Business Opportunities in Cambodian Exports
For companies aiming to enter Cambodia's growing export market, identifying buyers is critical. With Tendata's trade database, users can search by keyword or HS code to quickly find thousands of verified potential customers, complete with transaction records, purchasing cycles, and contact information—saving time in market development.
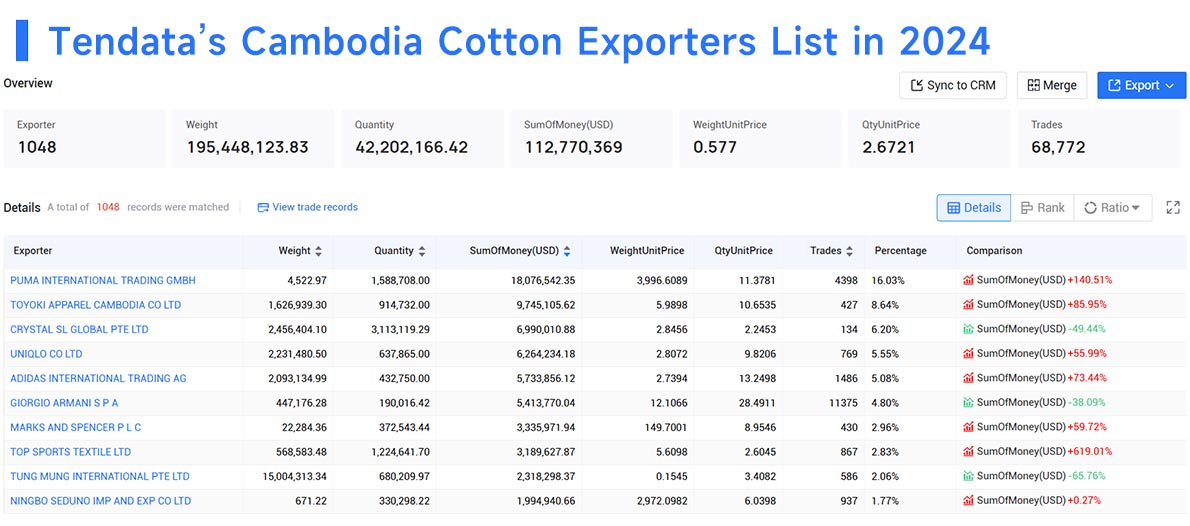
For example, cotton product suppliers in Cambodia can be located instantly using Tendata tools.>>Find more Cambodian clients
1.PUMA INTERNATIONAL TRADING GMBH(16.03%, $18.08 Million)
2.TOYOKI APPAREL CAMBODIA CO LTD(8.64%, $9.75 Million)
3.CRYSTAL SL GLOBAL PTE LTD(6.2%, $6.99 Million)
4.UNIQLO CO LTD(5.55%, $6.26 Million)
5.ADIDAS INTERNATIONAL TRADING AG(5.08%, $5.73 Million)
6.GIORGIO ARMANI S P A(4.8%, $5.41 Million)
7.MARKS AND SPENCER P L C(2.96%, $3.34 Million)
8.TOP SPORTS TEXTILE LTD(2.83%, $3.19 Million)
9.TUNG MUNG INTERNATIONAL PTE LTD(2.06%, $2.32 Million)
10.NINGBO SEDUNO IMP AND EXP CO LTD(1.77%, $1.99 Million)

Whether you're a seasoned exporter or new to global trade, Cambodia's export data provides valuable market intelligence to uncover opportunities and connect with the right partners. Contact Tendata for more details or to arrange a free online demo.
Category
Leave Message for Demo Request or Questions


 T-info
 T-discovery

 My
Tendata
 Market Analysis
 Customer
Development
 Competitor
Monitoring
 Customer Relationship


