 Export News
 2025-08-13
Situated in the heart of South America and bordered by Brazil, Argentina, and Bolivia, Paraguay's export performance reached US $10.8 billion in 2024.
This figure marks a 26.8% growth compared with the US $8.5 billion registered in 2020. However, compared to 2023's US $11.9 billion, Paraguay's export revenues dipped by 9%.
According to the 2024 average exchange rate, the Paraguayan guaraní weakened by 10.7% against the US dollar over the past five years and dropped by another 3.5% from 2023. This currency depreciation has made Paraguay's export products priced in US dollars more affordable for overseas buyers.

Main Destinations for Paraguayan Goods
Recent trade statistics indicate that 87.7% of Paraguay's export value was purchased by a small group of countries, led by:
1.Brazil – 32.2%
2.Argentina – 31%
3.Chile – 8.6%
4.United States – 3.8%
5.Taiwan – 2.1%
6.Russia – 1.9%
7.Peru – 1.7%
8.Netherlands – 1.54%
9.Israel – 1.53%
10.Uruguay – 1.52%
11.India – 0.9%
12.Bolivia – 0.8%
By continent, Latin America (excluding Mexico but including the Caribbean) accounted for 77.3% of Paraguay's export value, followed by Asia (9.7%) and Europe (7.1%). North America received 4.5%, Africa 1.3%, while Oceania (mainly Australia and New Zealand) represented just 0.07%.
With a population of 6.9 million, Paraguay's export earnings in 2024 equate to roughly $1,550 per person, slightly down from $1,600 in 2023.
Top Exported Products from Paraguay
Using the 2-digit Harmonized Tariff System classification, the main categories in Paraguay's export portfolio in 2024 were:
1.Oil seeds – US $3.4 billion (31.5%)
2.Meat – US $1.83 billion (17%)
3.Mineral fuels & oils – US $1.15 billion (10.7%)
4.Cereals – US $897 million (8.3%)
5.Food industry waste & animal feed – US $674 million (6.2%)
6.Animal/vegetable fats & oils – US $515.3 million (4.8%)
7.Electrical machinery & equipment – US $375 million (3.5%)
8.Aluminum – US $165.2 million (1.5%)
9.Other chemical products – US $150.5 million (1.4%)
10.Beverages, spirits & vinegar – US $126 million (1.2%)
These ten sectors together accounted for 86% of Paraguay's export value. Aluminum led growth with a 67.9% surge from 2023, followed by chemical goods (+15.5%) and meat products (+12.6%). The sharpest decline was in animal feed and food waste (-32%).
Leading Products at the 4-Digit HS Code Level
The most valuable products in Paraguay's export list were:
1.Soya beans – 29.4% of total exports
2.Electrical energy – 10.7%
3.Frozen beef – 8.8%
4.Fresh or chilled beef – 7.1%
5.Soybean oilcake & solid residues – 5.5%
6.Rice – 4.1%
7.Soybean oil – 3.8%
8.Insulated wire/cable – 3.2%
9.Corn – 3%
10.Other oil seeds – 1.9%
Finding Buyers in Paraguay
For companies aiming to expand into Paraguay's export market, identifying reliable buyers is essential. With Tendata's advanced tools—such as keyword search and HS code filters—businesses can quickly pinpoint thousands of verified clients, check purchasing trends, and access contact details, drastically cutting the time needed for market entry.
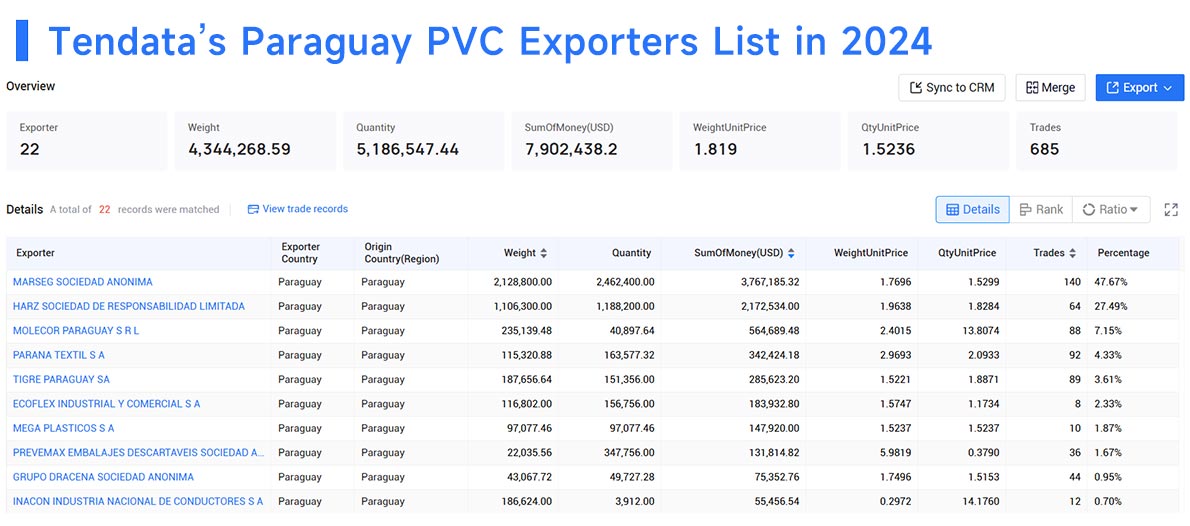
For example, when researching PVC demand, Tendata's platform can instantly reveal the top 10 suppliers in Paraguay for 2024. >>Find more Paraguay clients
1.MARSEG SOCIEDAD ANONIMA(47.67%, $3.77 Million)
2.HARZ SOCIEDAD DE RESPONSABILIDAD LIMITADA(27.49%, $2.17 Million)
3.MOLECOR PARAGUAY S R L(7.15%, $0.56 Million)
4.PARANA TEXTIL S A(4.33%, $0.34 Million)
5.TIGRE PARAGUAY SA(3.61%, $0.29 Million)
6.ECOFLEX INDUSTRIAL Y COMERCIAL S A(2.33%, $0.18 Million)
7.MEGA PLASTICOS S A(1.87%, $0.15 Million)
8.PREVEMAX EMBALAJES DESCARTAVEIS SOCIEDAD ANONIMA(1.67%, $0.13 Million)
9.GRUPO DRACENA SOCIEDAD ANONIMA(0.95%, $0.08 Million)
10.INACON INDUSTRIA NACIONAL DE CONDUCTORES S A(0.7%, $0.06 Million)

Whether you're a seasoned trader or a newcomer, using Paraguay's export data can uncover valuable market opportunities. For more information on Paraguay's export statistics or import data, contact Tendata for a free online demo.
Category
Leave Message for Demo Request or Questions


 T-info
 T-discovery

 My
Tendata
 Market Analysis
 Customer
Development
 Competitor
Monitoring
 Customer Relationship


