 Export News
 2025-08-13
Situated between two of Asia's largest economies, China and India, the Federal Democratic Republic of Nepal recorded approximately US $1.27 billion in global export sales during 2024.
This figure marks a 48.3% jump compared to the US $855.4 million achieved in 2020. However, on a year-to-year basis, the growth pace slowed, with export values increasing only 2.4% from US $1.24 billion in 2023.
According to the average 2024 exchange rate, the Nepalese rupee depreciated by -11.5% against the US dollar since 2020 and by -1.3% compared with 2023. The weaker currency made Nepal's export goods—when priced in US dollars—more competitively priced for overseas buyers.

Key Overseas Markets for Nepal's Exports
The most recent detailed trade data (2022) reveals that 94.9% of Nepal's outbound goods were purchased by the following countries:
1.India – 71.9% of total exports
2.United States – 11.3%
3.Germany – 2.5%
4.Türkiye – 2%
5.United Kingdom – 1.8%
6.France – 1%
7.Australia – 0.83%
8.Japan – 0.8%
9.Canada – 0.78%
10.Italy – 0.76%
11.Netherlands – 0.6%
12.Denmark – 0.55%
By continent, Asia absorbed 77.5% of Nepal's exports, followed by North America (12.1%) and Europe (9.2%). Smaller proportions were shipped to Oceania (0.9%, mainly Australia and New Zealand), Africa (0.2%), and Latin America & the Caribbean (0.1%).
With a population of about 31.3 million, Nepal's total 2024 exports work out to roughly US $41 per person, up slightly from US $40 in 2023.
Nepal's Leading 10 Export Categories (2024)
Based on 2-digit Harmonized Tariff System codes, the top categories for Nepalese exports were:
1.Animal/vegetable fats, oils, waxes – US $155.2 million (12.2% of total exports)
2.Coffee, tea, spices – $106.8 million (8.4%)
3.Iron, steel – $102.7 million (8.1%)
4.Textile floor coverings – $98.6 million (7.8%)
5.Manmade staple fibers – $92.9 million (7.3%)
6.Wood – $75.1 million (5.9%)
7.Beverages, spirits, vinegar – $64.3 million (5.1%)
8.Food industry waste, animal fodder – $49.5 million (3.9%)
9.Clothing, accessories (not knit/crochet) – $46.7 million (3.7%)
10.Miscellaneous textiles, worn clothing – $46 million (3.6%)
These ten categories combined accounted for 66% of Nepal's export earnings.
Fastest-Growing Export Segments
Animal/vegetable fats, oils, waxes surged 85.9% from 2023 to 2024, making it the top growth leader.
·Wood products followed with a 39.5% increase.
·Clothing and accessories (non-knit) edged up by 0.2%.
·The sharpest decline came from miscellaneous textiles and worn clothing, which fell -13.2% year over year.
Top Products at the 4-Digit HS Level
Nepal's most valuable single export in 2024 was soya-bean oil (7.5% of total exports). Other major items included:
1.Knotted textile floor coverings (6.7%)
2.Synthetic staple fiber yarn (6.6%)
3.Coated flat-rolled iron or steel products (6.1%)
4.Nutmeg and cardamoms (5%)
5.Non-alcoholic beverages excluding water (4.9%)
6.Laminated wood (4.8%)
7.Woven fabrics (2.9%)
8.Palm oil (2.7%)
9.Tea, including flavored varieties (2.6%)
Together, the top 10 detailed products made up 49.7% of all Nepalese export sales.
Using Trade Data to Enter Nepal's Export Market
Businesses aiming to enter or expand in the Nepalese market can benefit greatly from detailed Nepal trade data. With tools like Tendata's keyword and HS code search, traders can identify thousands of potential buyers within minutes—complete with purchasing history, buying cycles, and contact details—cutting down market development time significantly.
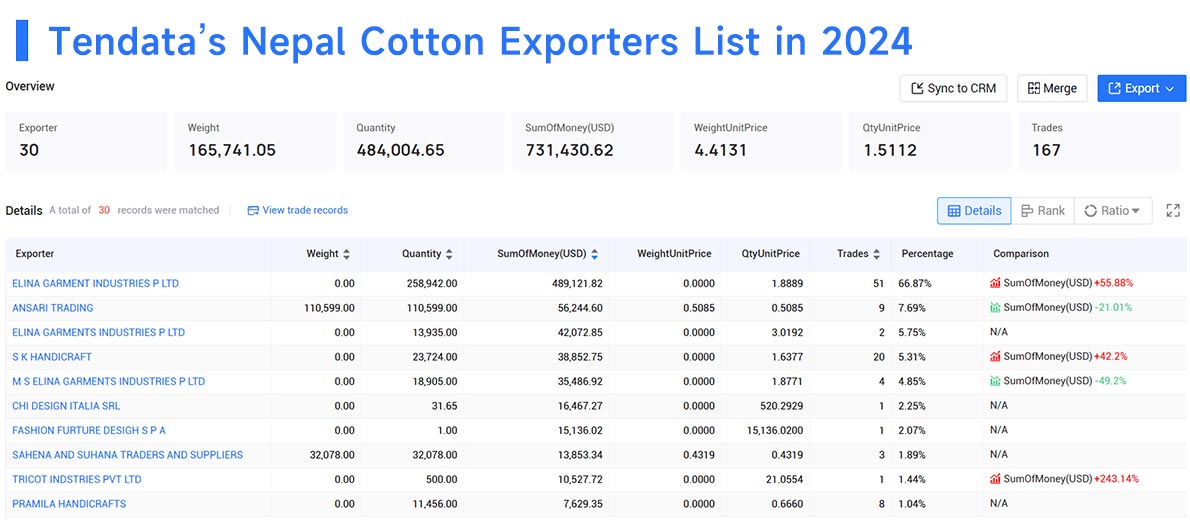
For example, cotton market analysis can reveal the top 10 purchasers in Nepal for 2024: >> Find more Nepal clients
1.ELINA GARMENT INDUSTRIES P LTD(66.87%, $0.49 Million)
2.ANSARI TRADING(7.69%, $0.06 Million)
3.ELINA GARMENTS INDUSTRIES P LTD(5.75%, $0.04 Million)
4.S K HANDICRAFT(5.31%, $0.04 Million)
5.M S ELINA GARMENTS INDUSTRIES P LTD(4.85%, $0.04 Million)
6.CHI DESIGN ITALIA SRL(2.25%, $0.02 Million)
7.FASHION FURTURE DESIGH S P A(2.07%, $0.02 Million)
8.SAHENA AND SUHANA TRADERS AND SUPPLIERS(1.89%, $0.01 Million)
9.TRICOT INDSTRIES PVT LTD(1.44%, $0.01 Million)
10.PRAMILA HANDICRAFTS(1.04%, $0.01 Million)

Whether you're an established player in global trade or just starting out, using Nepal's export data can uncover profitable opportunities and reliable partners. For more details on Nepal's import/export statistics, contact Tendata and arrange a free online demo.
Category
Leave Message for Demo Request or Questions


 T-info
 T-discovery

 My
Tendata
 Market Analysis
 Customer
Development
 Competitor
Monitoring
 Customer Relationship


