 Export News
 2025-08-14
In 2024, global plastic exports reached an estimated US $103.2 billion.
Compared with 2020, when plastic exports totaled $86.4 billion, the sector expanded by 19.5% over five years. On a yearly basis, plastic exports by country increased 2.5%, up from $100.7 billion in 2023.
The top five countries for plastic exports—Mainland China, Germany, the United States, Italy, and France—collectively generated nearly 58.6% of the global total, highlighting the dominance of these manufacturing hubs in international trade.
Regionally, Asia accounted for the largest share of plastic exports at 45.7%, followed by Europe with 39.8% and North America at 12.7%.
Smaller proportions of plastic exports came from Latin America (0.79%, excluding Mexico but including the Caribbean), Africa (0.78%), and Oceania (0.2%), where Australia and New Zealand led shipments.
For customs purposes, the relevant Harmonized Tariff System (HTS) code for plastic exports is 3926.

Top 15 Countries for Plastic Exports in 2024
The leading nations ranked by plastic exports value in 2024 were:
1.Mainland China – $33 billion (32% of global plastic exports)
2.Germany – $11.1 billion (10.8%)
3.United States – $9.1 billion (8.8%)
4.Italy – $3.7 billion (3.6%)
5.France – $3.6 billion (3.5%)
6.Poland – $3.4 billion (3.3%)
7.Mexico – $2.72 billion (2.6%)
8.Netherlands – $2.7 billion (2.6%)
9.Czech Republic – $2.4 billion (2.3%)
10.Japan – $2 billion (1.9%)
11.Taiwan – $1.81 billion (1.8%)
12.South Korea – $1.75 billion (1.7%)
13.Vietnam – $1.72 billion (1.7%)
14.United Kingdom – $1.69 billion (1.6%)
15.Belgium – $1.62 billion (1.6%)
Together, these 15 nations accounted for 79.7% of all plastic exports in 2024.
Growth in Plastic Exports Year Over Year
From 2023 to 2024, the fastest-growing plastic exports markets were:
·Vietnam (+23.2%)
·United Kingdom (+9.6%)
·Mexico (+6.5%)
·Czech Republic (+5.6%)
By contrast, Japan (-3.3%) and Germany (-2.2%) recorded declines in plastic exports during the same period.
Top Plastic Exports Companies in 2024
Based on Tendata trade intelligence, the top companies driving plastic exports globally in 2024 were:
1.CÔNG TY TNHH SẢN XUẤT DỊCH VỤ KHẮC DẤU TIẾN DŨNG(5.57%, $2187.58 Million)
2.CÔNG TY TNHH OLMISH ASIA FOOD(2.05%, $804.11 Million)
3.HOUSE TECHNOLOGY INDUSTRIES PTE LTD(1.81%, $712.48 Million)
4.CÔNG TY TNHH HỆ THỐNG DÂY DẪN SUMI VIỆT NAM(1.39%, $547.55 Million)
5.HOUSE TECHNOLOGY INDUSTRIES PTE(1.19%, $466.25 Million)
6.CÔNG TY TNHH MASKA GLOBAL(1.09%, $428.45 Million)
7.CÔNG TY TNHH HÓA CHẤT HYOSUNG VINA(1.06%, $418.32 Million)
8.CÔNG TY TNHH BILLION INDUSTRIAL VIỆT NAM(0.99%, $387.87 Million)
9.CÔNG TY TNHH POLYTEX FAR EASTERN VIỆT NAM(0.96%, $375.71 Million)
10.CÔNG TY TNHH DÂY CÁP ĐIỆN Ô TÔ SUMIDEN VIỆT NAM(0.78%, $305.78 Million)
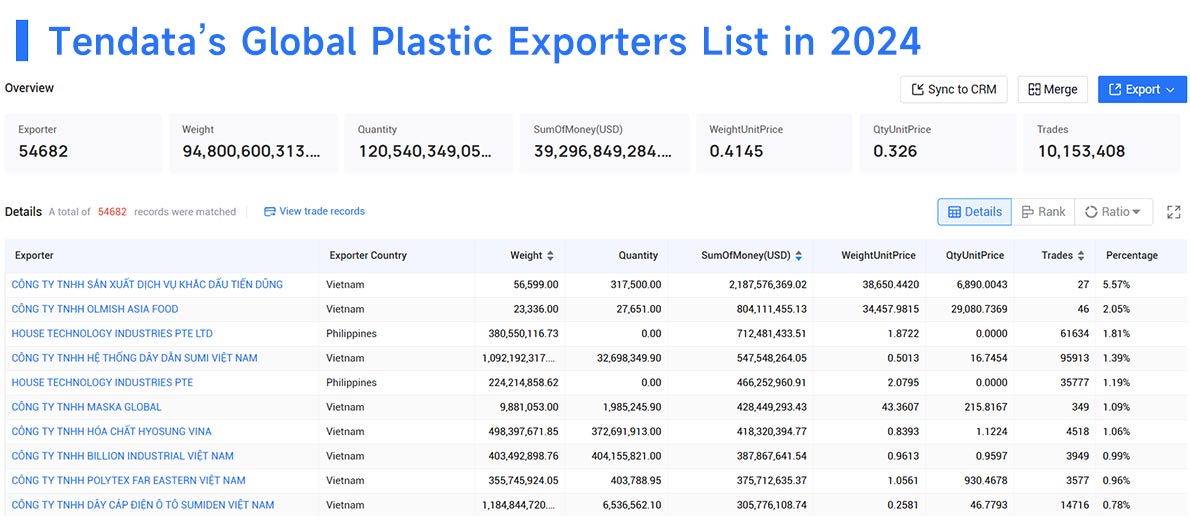
How to find Plastic Items Exporters via Tendata Plastic Export Data?
With Tendata, you can quickly get a directory of LED suppliers with real export records in the recent year.
Enterprises can analyze the market from multiple dimensions, including supply frequency, supply quantity, supply products, supply price, supply chain, and buyers. With this trade data, companies can gain insight into their customers' supply habits and preferences to develop precise marketing strategies and customized service solutions.
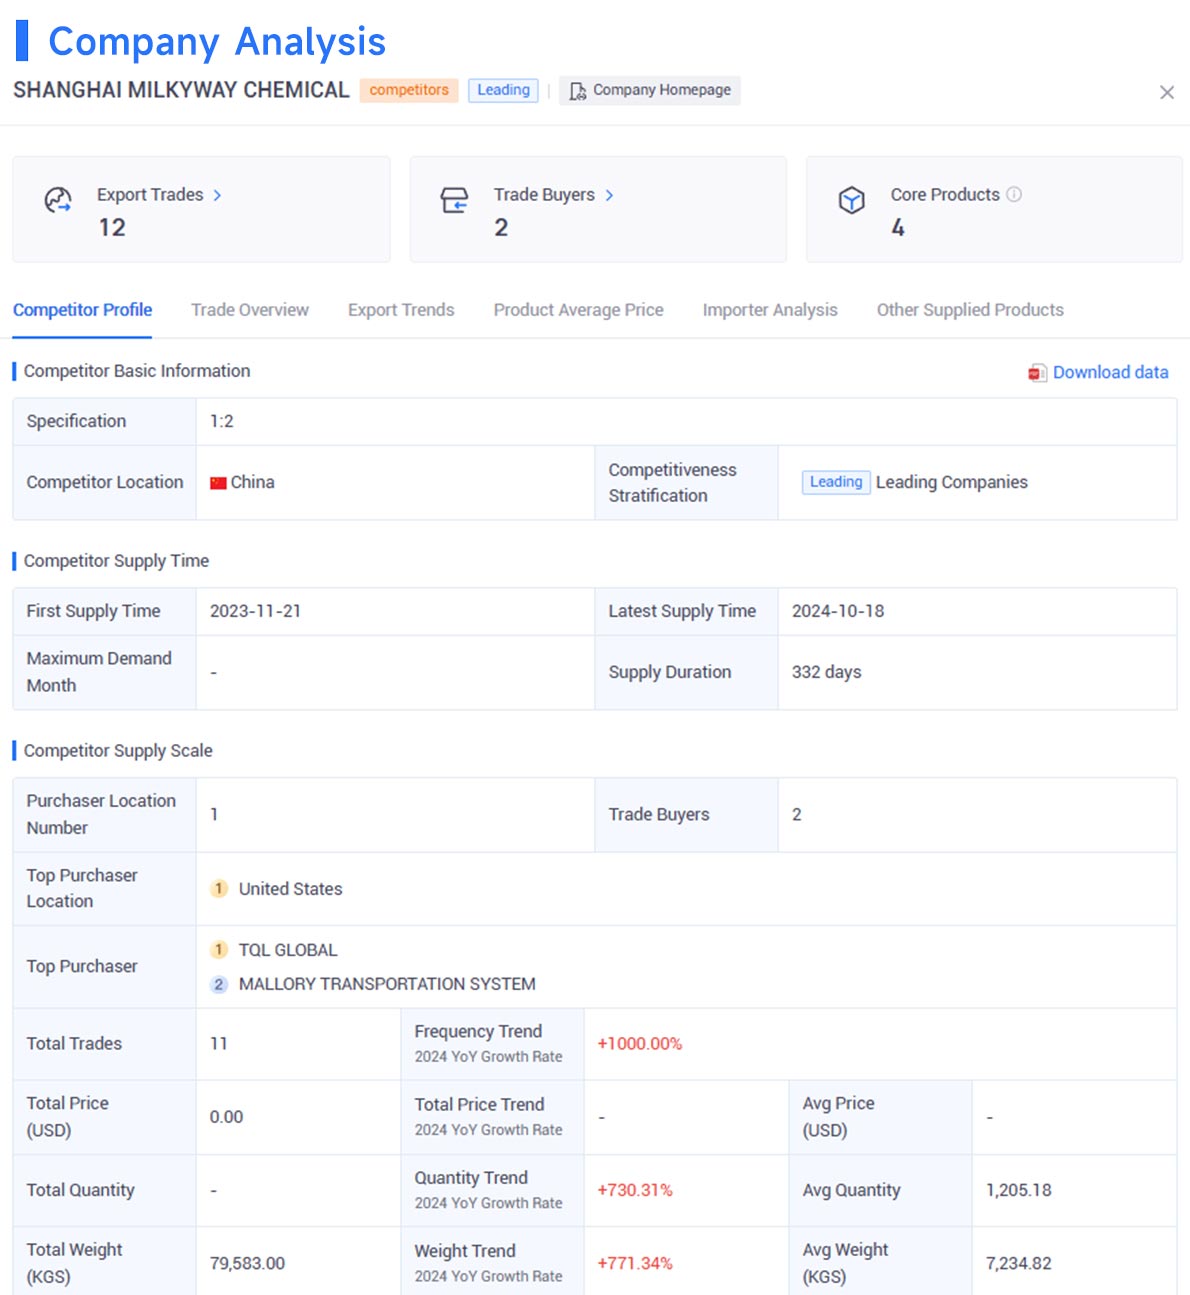
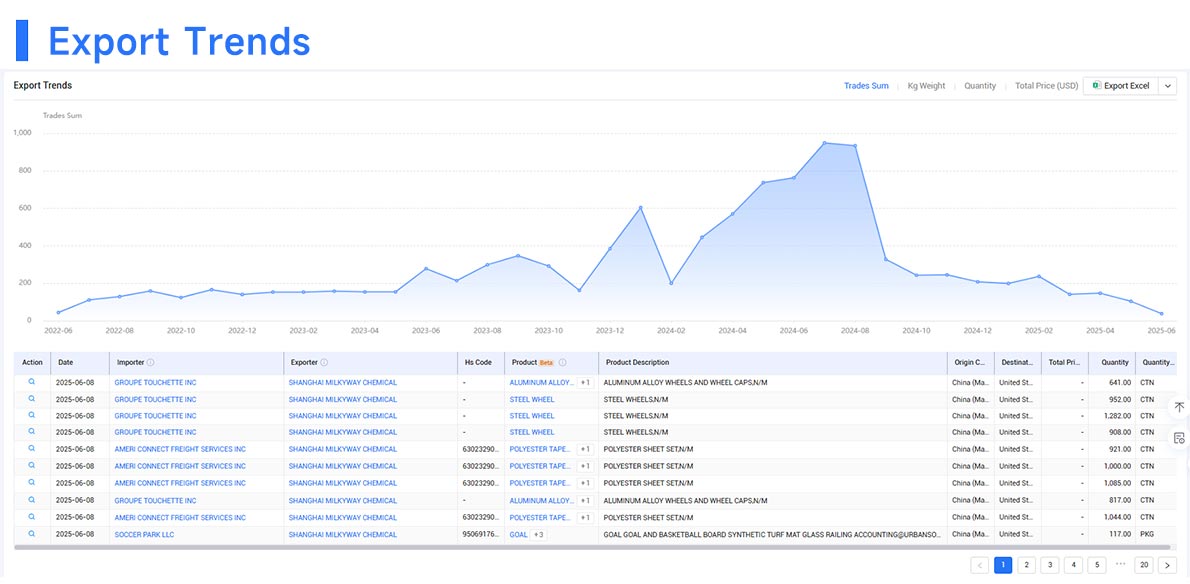
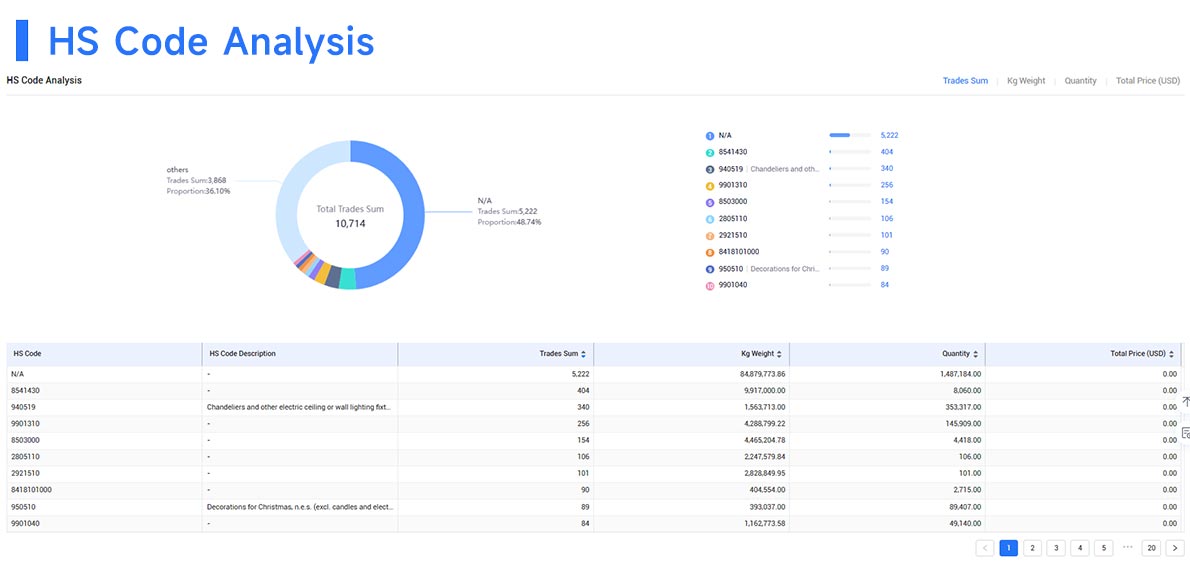
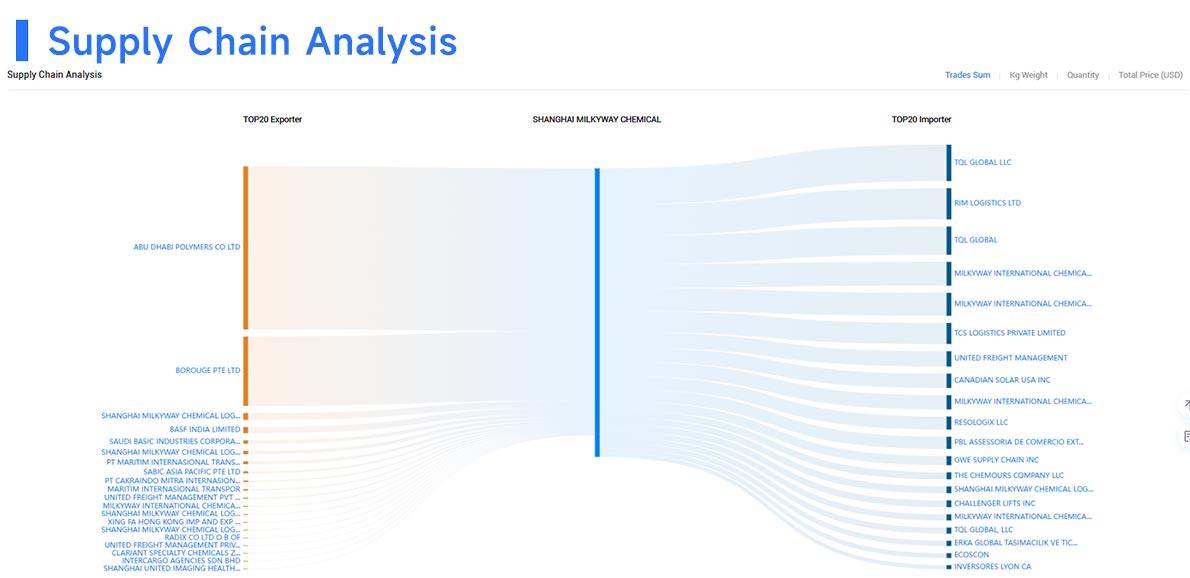
Image source: Tendata
Tendata also provides key contacts such as purchasing and executives of target customers and supports personalized connections with these decision makers through social media platforms such as LinkedIn and Facebook. This approach helps us to quickly target potential customers and improve development efficiency.
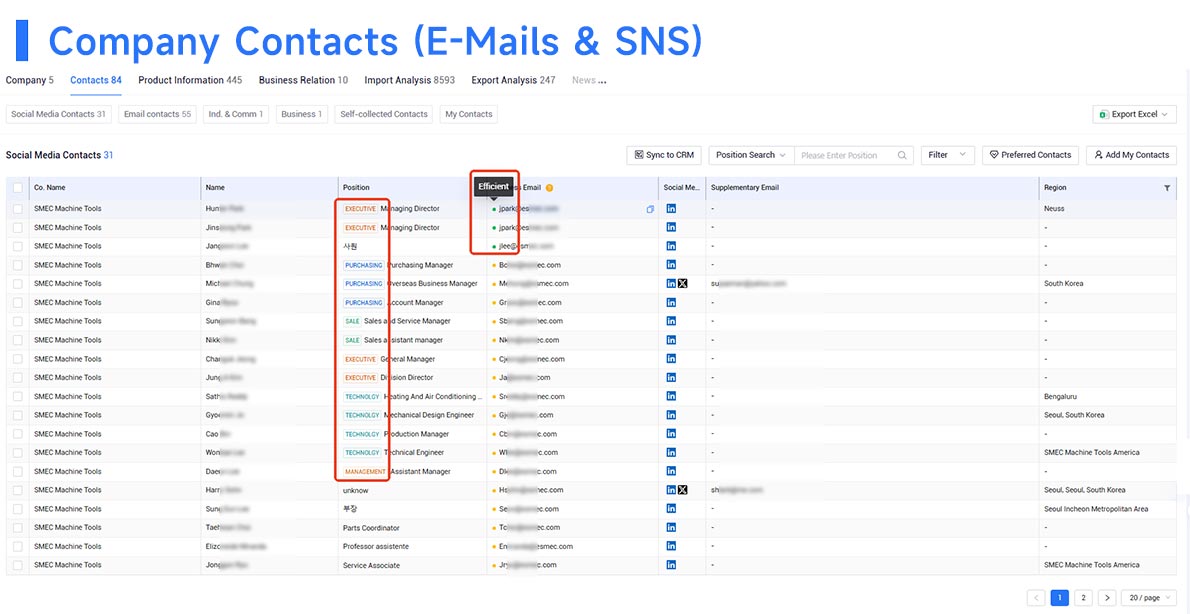
Image source: Tendata
Category
Leave Message for Demo Request or Questions


 T-info
 T-discovery

 My
Tendata
 Market Analysis
 Customer
Development
 Competitor
Monitoring
 Customer Relationship


