 Export News
 2025-08-19
Located on the eastern edge of Southeast Asia's Indochina Peninsula, the Socialist Republic of Vietnam exported goods valued at US$499.8 billion in 2024.
This amount represents a 77.6% jump compared to 2020, when the country's global shipments totaled $281.4 billion. On a year-to-year basis, Vietnam's exports climbed 41.6% from $353.1 billion in 2023.
According to 2024 exchange rate data, the Vietnamese dong strengthened by 4.9% against the US dollar compared with the prior year. While this stronger currency indicates economic resilience, it also makes Vietnamese exports priced in US dollars more costly for overseas buyers, particularly those dealing in American currency.

Vietnam's Major Export Destinations
The latest trade statistics show that 74.9% of Vietnam's shipments were purchased by the following economies:
1.United States (27.5%)
2.Mainland China (17.2%)
3.South Korea (6.64%)
4.Japan (6.6%)
5.Netherlands (2.9%)
6.Hong Kong (2.7%)
7.India (2.4%)
8.Germany (2.1%)
9.Thailand (2%)
10.United Kingdom (1.8%)
11.Canada (1.6%)
12.Australia (1.5%)
From a regional perspective, nearly half of Vietnam's exports (49.6%) went to Asian countries, while 30.8% were sent to North America and another 15% to Europe. Smaller proportions reached Latin America (1.9%), Oceania (1.7%), and Africa (0.9%).
With a population of about 101.3 million people, the export value of $499.8 billion equates to roughly $4,900 per capita, an improvement from $4,500 in 2023.
Vietnam's Top 10 Exports in 2024
The leading export categories for Vietnam are listed below, showing their dollar value and share of overall global sales:
1.Electrical machinery and equipment: US$192.1 billion (38.4% of total exports)
2.Machinery including computers: $74.2 billion (14.8%)
3.Footwear: $33.9 billion (6.8%)
4.Furniture, bedding, lighting, signs, prefabricated buildings: $19.3 billion (3.9%)
5.Clothing, accessories (non-knit): $19.3 billion (3.9%)
6.Knit or crochet clothing and accessories: $19.2 billion (3.8%)
7.Plastics and plastic items: $9.9 billion (2%)
8.Iron and steel: $8.7 billion (1.7%)
9.Fruits and nuts: $7.7 billion (1.5%)
10.Rubber and rubber goods: $7.1 billion (1.4%)
Altogether, these top 10 groups accounted for 78.3% of Vietnam's total export revenues.
The fastest-growing segment was machinery including computers, which more than doubled with a 130.1% surge from 2023 to 2024. Coming next, footwear exports rose 63.3%, followed by a 59.7% increase in furniture and related goods.
Detailed Export Breakdown (4-Digit HS Codes)
At a more specific product level:
1.Phones and smartphones: 11.8% of total exports
2.Computers/optical readers: 6.5%
3.Electronic integrated circuits/microassemblies: 5.9%
4.Flat panel displays: 5.6%
5.Computer parts/accessories: 4.4%
6.Textile footwear: 2.8%
7.Leather footwear: 2.4%
8.Television, radio, radar components: 2.2%
9.Furniture items: 2%
10.Microphones, headphones, amplifiers: 1.8%
Combined, these top 10 products generated 45.5% of Vietnam's export income.
Vietnam's Export Companies
Businesses looking to enter Vietnam's export market must identify reliable suppliers. With Tendata's advanced tools—including HS code filters, keyword search, and detailed buyer databases—companies can quickly find verified customers, study trade flows, and cut down on research time.
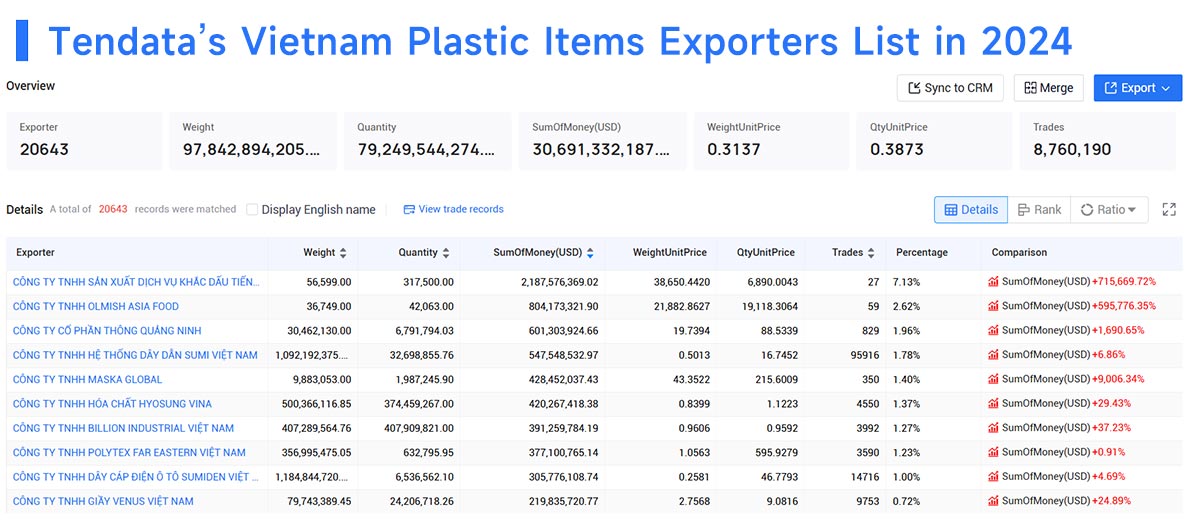
For instance, within the plastics sector, Tendata data for 2024 lists Vietnam's top 10 suppliers as:
1.CÔNG TY TNHH SẢN XUẤT DỊCH VỤ KHẮC DẤU TIẾN DŨNG (7.13%, $2187.58M)
2.CÔNG TY TNHH OLMISH ASIA FOOD (2.62%, $804.17M)
3.CÔNG TY CỔ PHẦN THÔNG QUẢNG NINH (1.96%, $601.3M)
4.CÔNG TY TNHH HỆ THỐNG DÂY DẪN SUMI VIỆT NAM (1.78%, $547.55M)
5.CÔNG TY TNHH MASKA GLOBAL (1.4%, $428.45M)
6.CÔNG TY TNHH HÓA CHẤT HYOSUNG VINA (1.37%, $420.27M)
7.CÔNG TY TNHH BILLION INDUSTRIAL VIỆT NAM (1.27%, $391.26M)
8.CÔNG TY TNHH POLYTEX FAR EASTERN VIỆT NAM (1.27%, $377.1M)
9.CÔNG TY TNHH DÂY CÁP ĐIỆN Ô TÔ SUMIDEN VIỆT NAM (1.23%, $305.78M)
10.CÔNG TY TNHH GIẦY VENUS VIỆT NAM (1%, $219.84M)

Whether you are a first-time trader or an experienced exporter, analyzing Vietnam's export performance is key to spotting new opportunities in international markets. To gain deeper insights into Vietnam's trade statistics, companies can request a free demo from Tendata.
Category
Leave Message for Demo Request or Questions


 T-info
 T-discovery

 My
Tendata
 Market Analysis
 Customer
Development
 Competitor
Monitoring
 Customer Relationship


