 Export News
 2025-08-22
Situated in the heart of Central Europe and sharing borders with Germany, Hungary, Slovakia, Slovenia, Italy, Switzerland, and Liechtenstein, the Republic of Austria exported goods worth US$213.9 billion worldwide in 2024.
This figure reflects a 31.9% increase compared with $162.1 billion in 2020, although it also represents a slight -1.1% decline from the $216.2 billion achieved in 2023.
In terms of currency effects, Austria trades in the euro, which in 2024 edged up only 0.02% against the US dollar compared with the previous year. This marginal strengthening of the EU's common currency made Austrian exports a little more expensive for international customers paying in US dollars.

Austria's Main Export Markets
The latest statistics show that around 74% of Austria's exports were purchased by just a dozen major partners:
·Germany (29.2%)
·United States (8.2%)
·Italy (6%)
·Switzerland (5%)
·Slovakia (3.94%)
·Poland (3.89%)
·France (3.6%)
·Hungary (3.5%)
·Czech Republic (3.4%)
·China (2.7%)
·United Kingdom (2.5%)
·Slovenia (2.1%)
From a regional perspective, Europe absorbed 78.1% of Austria's shipments, followed by North America (9.9%) and Asia (9.3%). Smaller shares went to Africa (1.1%), Latin America including the Caribbean but excluding Mexico (1%), and Oceania (0.6%), mainly Australia and New Zealand.
With a population of 9.13 million, Austria's $213.9 billion in exports translates to about $23,400 per resident in 2024, slightly down from $24,700 per capita in 2023.
Leading Austrian Export Categories
The top 10 product groups exported by Austria in 2024 were:
1.Machinery including computers: US$36.1 billion (16.9%)
2.Electrical machinery & equipment: $23 billion (10.7%)
3.Pharmaceuticals: $21 billion (9.8%)
4.Vehicles: $20.4 billion (9.5%)
5.Plastics & plastic items: $9.1 billion (4.3%)
6.Iron & steel: $8.7 billion (4.1%)
7.Articles of iron or steel: $7.2 billion (3.3%)
8.Mineral fuels including oil: $6.1 billion (2.9%)
9.Optical, technical & medical devices: $6 billion (2.8%)
10.Wood: $5.5 billion (2.6%)
These categories collectively accounted for 66.9% of Austria's overall export revenues.
·Pharmaceuticals saw the sharpest annual growth at +19.3%.
·Electrical machinery followed with +13.6%.
·Plastics and plastic goods posted a more modest gain of +3.5%.
The biggest drop came from mineral fuels, down -21.4% year over year.
At a more detailed 4-digit HS code level, the top Austrian exports included:
1.Blood fractions & antisera (6.2%)
2.Cars (3.8%)
3.Packaged medication mixes (3.2%)
4.Smartphones & related devices (2.4%)
5.Car parts and accessories (2.3%)
6.Piston engines (1.5%)
7.Electrical energy (1.4%)
8.Non-alcoholic beverages (excl. water, juice, milk) (1.4%)
9.Electrical converters & power units (1.1%)
10.Flat-rolled alloy steel products (1.1%)
Austrian Export Companies
For firms aiming to do business with Austrian exporters, finding trustworthy suppliers is essential. Tools such as Tendata's database—equipped with keyword and HS code filters—allow businesses to locate verified buyers, analyze purchasing trends, and access direct contacts, helping reduce market entry time.
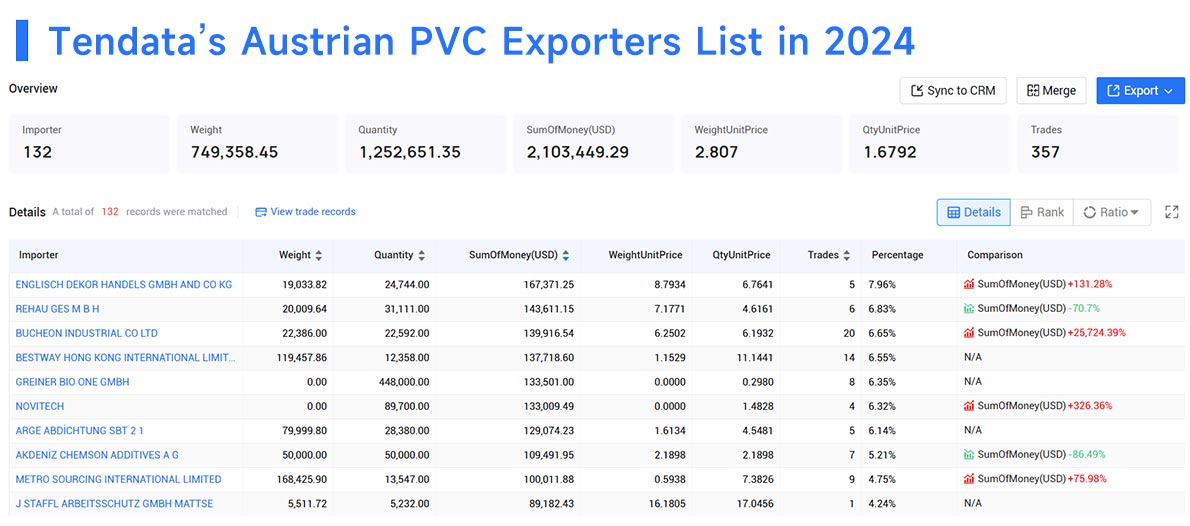
For instance, when researching PVC demand, Tendata can quickly highlight Austria's top 10 suppliers in 2024:
1.ENGLISCH DEKOR HANDELS GMBH & CO KG (7.96%, $0.17M)
2.REHAU GES M B H (6.83%, $0.14M)
3.BUCHEON INDUSTRIAL CO LTD (6.65%, $0.14M)
4.BESTWAY HONG KONG INTERNATIONAL LTD (6.55%, $0.14M)
5.GREINER BIO ONE GMBH (6.35%, $0.13M)
6.NOVITECH (6.32%, $0.13M)
7.ARGE ABDICHTUNG SBT 2 1 (6.14%, $0.13M)
8.AKDENIZ CHEMSON ADDITIVES AG (5.21%, $0.11M)
9.METRO SOURCING INTERNATIONAL LTD (4.75%, $0.10M)
10.J STAFFL ARBEITSSCHUTZ GMBH MATTSE (4.24%, $0.09M)
>>Get The Full List via Tendata<<

Whether you are an experienced trader or entering the market for the first time, analyzing Austrian exports provides valuable opportunities. For comprehensive datasets on exports and imports, Tendata offers free demos and detailed trade intelligence.
Category
Leave Message for Demo Request or Questions


 T-info
 T-discovery

 My
Tendata
 Market Analysis
 Customer
Development
 Competitor
Monitoring
 Customer Relationship


