 Export News
 2025-08-25
Located along the western coast of South America and bordered to the east by Brazil, the Republic of Peru shipped an estimated US$74.7 billion worth of goods worldwide in 2024.
This marks a significant 92.6% increase from $38.8 billion in 2020. On a year-over-year basis, Peru's exports rose by 16%, compared to the $64.4 billion achieved in 2023.
The Peruvian Sol also gained strength over time. Between 2020 and 2024, the currency appreciated by 7.2% against the US dollar, and by 0.4% between 2023 and 2024. This appreciation meant that Peru's exports, when priced in stronger Sols, became relatively more expensive for international buyers paying in US dollars.
Recent figures reveal that 82.7% of Peru's exports went to a select group of nations. Leading the list is China (33.8%), followed by the United States (12.8%), India (6.3%), Canada (5.1%), Japan (4.5%), and Switzerland (3.5%). Other notable buyers include the Netherlands, Chile, Spain, South Korea, UAE, and Brazil.
From a regional standpoint, over half (52.9%) of Peru's export shipments were directed to Asia. Another 19.2% went to North America, while 16.1% landed in Europe. The remaining exports were distributed to Latin America (11.2%), Africa (0.6%), and Oceania (0.1%)—primarily Australia and New Zealand.
With a national population of about 34.1 million, Peru's $74.7 billion export total equals roughly $2,200 per person in 2024. That's an increase from $1,850 per capita the year before.

Peru's Top 10 Export Categories
The following sectors represented the most valuable segments of Peru's export economy in 2024:
1.Ores, slag & ash – $29.4 billion (39.3%)
2.Precious metals & gems – $13.2 billion (17.7%)
3.Fruits & nuts – $6.5 billion (8.7%)
4.Mineral fuels including oil – $4.4 billion (5.9%)
5.Copper – $3.7 billion (4.9%)
6.Food industry waste & animal feed – $1.9 billion (2.5%)
7.Coffee, tea & spices – $1.4 billion (1.9%)
8.Cocoa – $1.3 billion (1.7%)
9.Knitwear & accessories – $1.12 billion (1.5%)
10.Fish – $1.07 billion (1.4%)
Together, these ten groups contributed 85.6% of Peru's export value.
·Cocoa ranked as the fastest-growing export, surging 196.6% year over year.
·Animal feed and food by-products came second with a 57.6% increase.
·Precious metals rose 52.5%, largely fueled by higher gold exports.
·The only declining category was fish, which dropped 21.8% in value.
From the more detailed HS code breakdown, Peru's leading shipments included:
1.Copper ores and concentrates (27.7%)
2.Unwrought gold (17%)
3.Refined copper (3.4%)
4.Refined petroleum oils (3.2%)
5.Fresh fruits (3.2%)
6.Precious metal ores (3%)
7.Zinc ores (2.4%)
8.Iron ores (2.4%)
9.Fresh or dried grapes (2.3%)
10.Molybdenum ores (2.3%)
Peru's Export Companies
For firms aiming to expand into the Peruvian export market, finding credible suppliers is critical. Using Tendata's trade intelligence platform, businesses can:
·Search suppliers by HS code or product keyword
·Access thousands of verified buyers
·Review trade history and trends
·Obtain direct contact information of potential partners
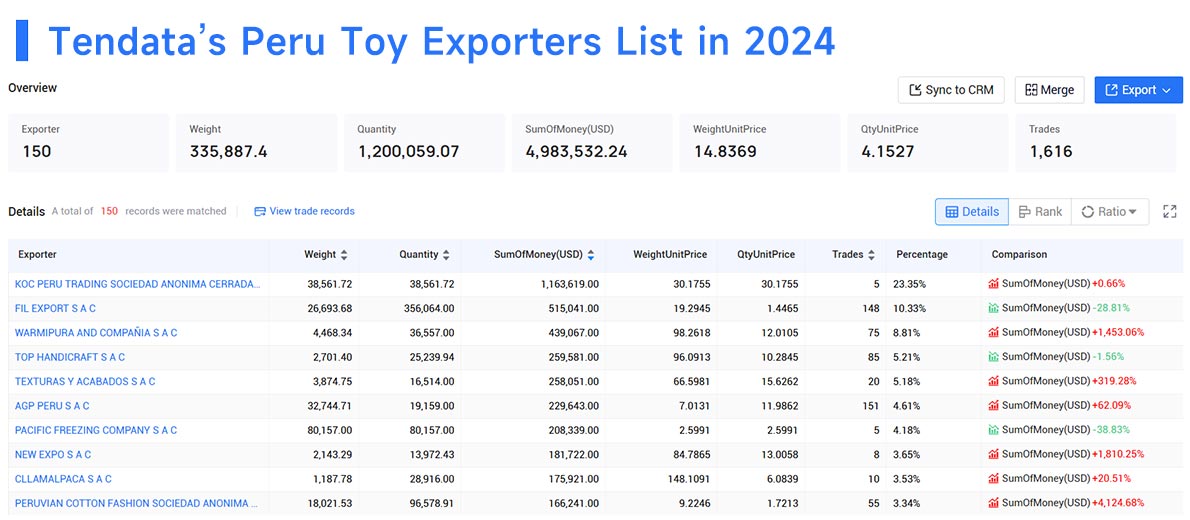
Example: In 2024, Tendata identified the Top 10 suppliers in Peru for toys, which include:
1.KOC PERU TRADING S.A.C. – 23.35% ($1.16M)
2.FIL EXPORT S.A.C. – 10.33% ($0.52M)
3.WARMIPURA Y COMPAÑIA S.A.C. – 8.81% ($0.44M)
4.TOP HANDICRAFT S.A.C. – 5.21% ($0.26M)
5.TEXTURAS Y ACABADOS S.A.C. – 5.18% ($0.26M)
6.AGP PERU S.A.C. – 4.61% ($0.23M)
7.PACIFIC FREEZING COMPANY S.A.C. – 4.18% ($0.21M)
8.NEW EXPO S.A.C. – 3.65% ($0.18M)
9.CLLAMALPACA S.A.C. – 3.53% ($0.18M)
10.PERUVIAN COTTON FASHION S.A.C. – 3.34% ($0.17M)

Whether you're an experienced exporter or just starting out, analyzing Peru's export data reveals powerful insights and opportunities. To access more detailed trade statistics or import records, reach out to Tendata for a free demo.
Category
Leave Message for Demo Request or Questions


 T-info
 T-discovery

 My
Tendata
 Market Analysis
 Customer
Development
 Competitor
Monitoring
 Customer Relationship


