 Export News
 2025-08-29
In 2024, the Republic of Türkiye recorded US$261.9 billion worth of exports shipped to global markets.
That figure reflects a 54.3% increase compared with $169.7 billion in 2020. However, year-on-year growth slowed, with export revenues edging up just 2.5% from $255.4 billion in 2023.
Due to a -29.8% depreciation of the Turkish lira against the US dollar in 2024, Türkiye's products became relatively cheaper for overseas buyers paying in stronger currencies.
The most valuable Turkish exports in 2024 included refined petroleum oils, automobiles, jewelry, vehicle parts, and trucks. Together, these goods represented 19.1% of Türkiye's overall export earnings—showing that the country maintains a fairly diversified export profile.
While Türkiye is traditionally famous for its rug exports, it also ranks strongly in trucks and jewelry.

Türkiye's Main Export Markets
Recent trade statistics reveal that 52.5% of Türkiye's exports were purchased by buyers in:
·Germany (7.8%)
·United States (6.2%)
·United Kingdom (5.8%)
·Iraq (5%)
·Italy (4.9%)
·France (3.8%)
·Spain (3.7%)
·Netherlands (3.3%)
·Russia (3.3%)
·United Arab Emirates (3.2%)
·Romania (3%)
·Poland (2.4%)
By continent, Europe absorbed 57.1% of Türkiye's exports, followed by Asia (24.8%), Africa (8.3%), North America (7.5%), Latin America (1.7%), and Oceania (0.7%).
With a population of about 85.8 million, Türkiye's $261.9 billion in exports equates to roughly $3,050 per person in 2024, up from $2,950 a year earlier.
Top 10 Turkish Export Categories (2024)
1.Vehicles: US$32.4 billion (12.4%)
2.Machinery incl. computers: $25.6 billion (9.8%)
3.Mineral fuels incl. oil: $16.5 billion (6.3%)
4.Electrical machinery & equipment: $16.4 billion (6.3%)
5.Gems & precious metals: $13 billion (5%)
6.Plastics & plastic articles: $10.9 billion (4.2%)
7.Iron & steel: $10.2 billion (3.9%)
8.Knit or crochet apparel & accessories: $10.1 billion (3.9%)
9.Articles of iron or steel: $9.8 billion (3.8%)
10.Non-knit/non-crochet apparel & accessories: $7.4 billion (2.8%)
Together, these top 10 goods accounted for 58.2% of Türkiye's total exports.
·Iron and steel posted the fastest growth (+15% since 2023).
·Electrical machinery & equipment rose by 7.3%.
·Vehicles increased by 5.2%.
The steepest decline came from non-knit clothing, which dropped -8.1% year-on-year.
Türkiye's Major Export Firms
For businesses eyeing Türkiye's markets, knowing the leading suppliers is key. With Tendata's platform, companies can quickly search by keyword or HS code, identify verified partners, and analyze purchasing trends to accelerate global expansion.
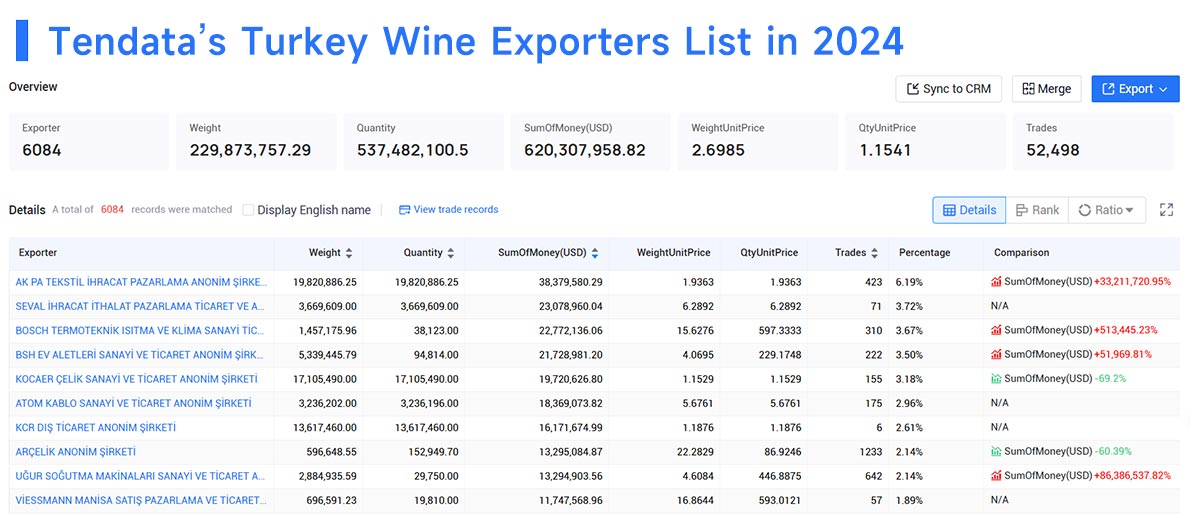
For example, when checking wine exports, Tendata instantly lists Türkiye's top 10 suppliers in 2024: >>Find More Turkish Suppliers
1.AK PA TEKSTİL İHRACAT PAZARLAMA A.Ş. (6.19%, $38.38M)
2.SEVAL İHRACAT İTHALAT PAZARLAMA TİC. A.Ş. (3.72%, $23.08M)
3.BOSCH TERMOTEKNİK ISITMA VE KLİMA SANAYİ TİC. A.Ş. (3.67%, $22.77M)
4.BSH EV ALETLERİ SANAYİ VE TİC. A.Ş. (3.5%, $21.73M)
5.KOCAER ÇELİK SANAYİ VE TİC. A.Ş. (3.18%, $19.72M)
6.ATOM KABLO SANAYİ VE TİC. A.Ş. (2.96%, $18.37M)
7.KCR DIŞ TİCARET A.Ş. (2.61%, $16.17M)
8.ARÇELİK A.Ş. (2.14%, $13.3M)
9.UĞUR SOĞUTMA MAKİNALARI SANAYİ VE TİC. A.Ş. (2.14%, $13.29M)
10.VİESSMANN MANİSA SATIŞ PAZARLAMA VE TİC. LTD. ŞTİ. (1.89%, $11.75M)

Whether you're a new entrant or experienced trader, leveraging Türkiye's trade data helps uncover promising opportunities. For detailed export/import insights, contact Tendata for a free demo.
Category
Leave Message for Demo Request or Questions


 T-info
 T-discovery

 My
Tendata
 Market Analysis
 Customer
Development
 Competitor
Monitoring
 Customer Relationship


