 Export News
 2025-08-29
Positioned at the heart of South Asia and bordered by major trade partners like China, Pakistan, and Bangladesh, the Republic of India exported goods worth US$441.8 billion worldwide in 2024.
That figure marks a 60.4% jump from the $275.5 billion recorded five years earlier in 2020.
Compared to 2023, however, India's export growth slowed, posting only a 2.4% increase from $431.4 billion.
On a Purchasing Power Parity basis, the Indian rupee depreciated -1.4% in 2024 versus 2023. This weaker local currency meant Indian products—priced in US dollars—were slightly more affordable to international buyers.
India continues to rank among the top global suppliers of diamonds, jewelry, and refined petroleum.

India's Leading Overseas Markets
Recent country-level trade data shows that 56% of India's exports were purchased by the following partners:
1.United States: 18.3% of India's total exports
2.United Arab Emirates: 8.5%
3.Netherlands: 5.6%
4.Singapore: 3.6%
5.China (mainland): 3.4%
6.United Kingdom: 3.2%
7.Saudi Arabia: 2.8%
8.Bangladesh: 2.6%
9.Germany: 2.4%
10.Italy: 1.92%
11.South Africa: 1.87%
12.Malaysia: 1.85%
By continent, 41.1% of India's exports stayed within Asia, 23% went to Europe, and 20.7% reached North America. Smaller portions were shipped to Africa (9.9%), Latin America including the Caribbean (3.4%), and Oceania (2%)—led by Australia and New Zealand.
Given India's 1.442 billion population, the $441.8 billion export value equals about $310 per person, slightly higher than the $300 per capita achieved in 2023.
India's Top 10 Export Categories (2024)
The most lucrative product groups shipped from India in 2024 were:
1.Mineral fuels including oil: US$75.4 billion (17.1%)
2.Electrical machinery & equipment: $40.2 billion (9.1%)
3.Machinery including computers: $32.5 billion (7.4%)
4.Gems & precious metals: $29.9 billion (6.8%)
5.Pharmaceuticals: $23.3 billion (5.3%)
6.Vehicles: $22.1 billion (5%)
7.Organic chemicals: $21 billion (4.7%)
8.Cereals: $12.1 billion (2.7%)
9.Iron & steel: $10.3 billion (2.3%)
10.Articles of iron or steel: $10.1 billion (2.3%)
Together, these top 10 categories made up 62.7% of India's overall export earnings.
·Electrical machinery showed the strongest year-over-year growth, surging 24.3%.
·Machinery including computers ranked second, up 10.9%.
·Pharmaceuticals followed with a 9.5% increase.
By contrast, mineral fuels fell sharply, sliding -15.6% from 2023.
Major Export Companies in India
For businesses aiming to expand in India's global trade sector, sourcing verified suppliers is crucial. With Tendata's smart tools—including HS code filters and keyword search—firms can instantly identify thousands of buyers, evaluate trade activity, and obtain direct contact details. This shortens the time required for market entry.
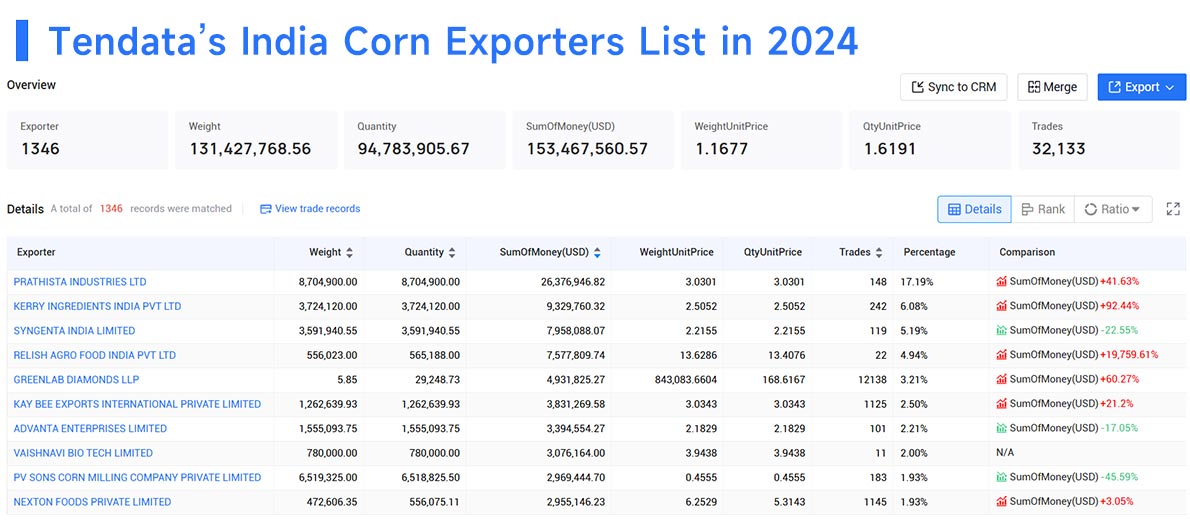
For instance, when exploring corn exports, Tendata's platform highlights India's top suppliers for 2024: >>Find More India Suppliers
1.PRATHISTA INDUSTRIES LTD (17.19%, $26.38M)
2.KERRY INGREDIENTS INDIA PVT LTD (6.08%, $9.33M)
3.SYNGENTA INDIA LIMITED (5.19%, $7.96M)
4.RELISH AGRO FOOD INDIA PVT LTD (4.94%, $7.58M)
5.GREENLAB DIAMONDS LLP (3.21%, $4.93M)
6.KAY BEE EXPORTS INTERNATIONAL PVT LTD (2.5%, $3.83M)
7.ADVANTA ENTERPRISES LTD (2.21%, $3.39M)
8.VAISHNAVI BIO TECH LTD (2%, $3.08M)
9.PV SONS CORN MILLING CO. PVT LTD (1.93%, $2.97M)
10.NEXTON FOODS PVT LTD (1.93%, $2.96M)

Whether you're a newcomer or seasoned exporter, leveraging India's trade data opens the door to valuable global opportunities. For deeper insights into India's export or import trends, contact Tendata for a free online demo.
Category
Leave Message for Demo Request or Questions


 T-info
 T-discovery

 My
Tendata
 Market Analysis
 Customer
Development
 Competitor
Monitoring
 Customer Relationship


