 Export News
 2025-09-03
Located at the crossroads of Southeastern and Eastern Europe, and bordering Serbia, Hungary, Ukraine, Moldova, and Bulgaria, Romania recorded US$100.4 billion in export revenues during 2024.
This figure reflects a 41.3% rise compared to the $71 billion exported in 2020. However, from a year-on-year perspective, shipments showed a slight -0.3% dip relative to $100.6 billion in 2023.
Currency shifts also influenced trade dynamics. Between 2020 and 2024, the Romanian leu depreciated by -7.6% against the US dollar, including a marginal -0.5% drop from 2023 to 2024. The weaker leu effectively made Romanian exports cheaper in terms of US dollars, boosting competitiveness abroad.

Main Destinations for Romanian Exports
Recent trade data shows that 69.5% of Romania's exports were purchased by a handful of countries:
1.Germany (20.5%)
2.Italy (9.6%)
3.France (6.3%)
4.Hungary (5.3%)
5.Bulgaria (4.4%)
6.Poland (4%)
7.Netherlands (3.64%)
8.Türkiye (3.59%)
9.Czech Republic (3.3%)
10.United Kingdom (3.14%)
11.Spain (3.11%)
12.United States (2.5%)
From a regional view, 84.3% of Romanian exports remained within Europe, while 9.7% went to Asia. Smaller shares reached North America (3%), Africa (2.5%), Latin America (0.4%), and Oceania (0.1%), mostly Australia and New Zealand.
Although Romania became a member of the European Union in 2007, the country still retains its own national currency. EU members accounted for 71.8% of Romanian export sales in 2024.
With a population of about 18.94 million, the 2024 export performance equates to roughly $5,300 per person, nearly identical to the 2023 level.
Romania's Top 10 Export Categories
Here are the leading export groups and their values in 2024:
1.Electrical machinery & equipment – $17.9B (17.9%)
2.Vehicles – $17.3B (17.3%)
3.Machinery incl. computers – $10.2B (10.2%)
4.Mineral fuels incl. oil – $4.9B (4.9%)
5.Rubber & rubber products – $3.6B (3.6%)
6.Cereals – $3.2B (3.2%)
7.Optical, technical & medical instruments – $3.2B (3.2%)
8.Iron & steel articles – $3.1B (3.1%)
9.Furniture, lighting & prefabricated buildings – $3B (3%)
10.Plastics & plastic articles – $2.6B (2.6%)
Together, these top 10 groups accounted for 68.8% of Romania's total exports.
Vehicles showed the strongest growth, up 10.8% year-over-year.
Rubber goods and machinery also rose modestly by 0.6% each.
The sharpest decline was seen in cereal exports, which fell -28.3%, mainly due to weaker wheat sales.
Detailed Product Breakdown
At the 4-digit HS code level, Romania's most valuable exports in 2024 included:
·Cars (8% of total exports)
·Auto parts & accessories (7.9%)
·Insulated wires & cables (4%)
·Electrical & optical circuit boards (3.8%)
·Refined petroleum oils (2.7%)
·New rubber tires (2.5%)
·Pharmaceutical dosage mixes (1.9%)
·Wheat (1.8%)
·Seats (1.5%)
·Electric water heaters & hair dryers (1.4%)
Export-Oriented Romanian Companies
For firms seeking to penetrate Romania's trade network, reliable supplier identification is essential. Tools like Tendata's HS code search and buyer tracking features help businesses find thousands of verified customers, understand demand trends, and access contact information.
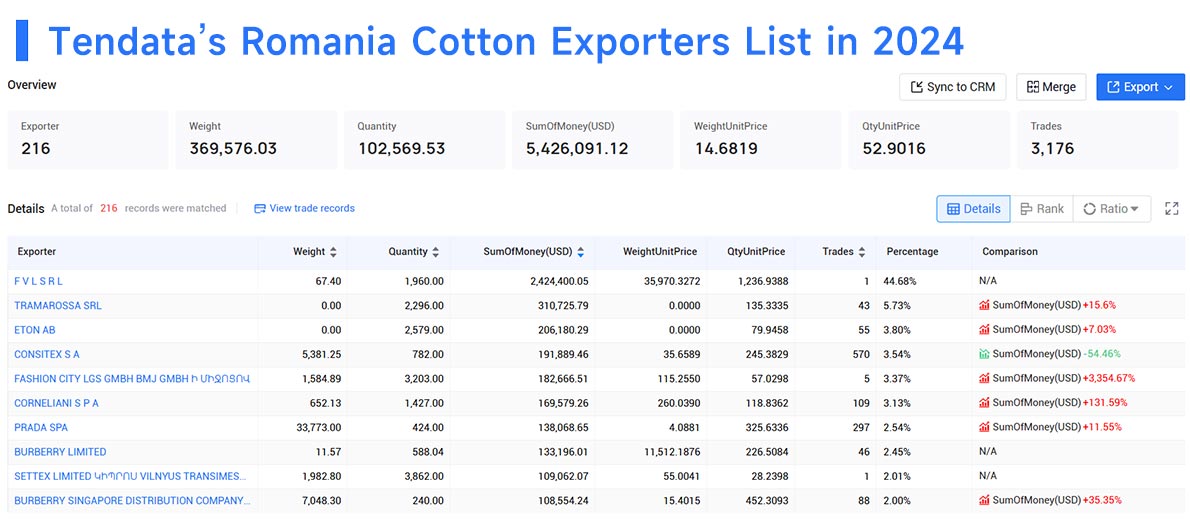
An example is Romania's Cotton sector, where Tendata's data shows the top 10 suppliers for 2024:
1.F V L SRL – 44.68% ($2.42M)
2.TRAMAROSSA SRL – 5.73% ($0.31M)
3.ETON AB – 3.8% ($0.21M)
4.CONSITEX SA – 3.54% ($0.19M)
5.FASHION CITY LGS GMBH BMJ GMBH – 3.37% ($0.18M)
6.CORNELIANI SPA – 3.13% ($0.17M)
7.PRADA SPA – 2.54% ($0.14M)
8.BURBERRY LIMITED – 2.45% ($0.13M)
9.SETTEX LIMITED (Cyprus) – 2.01% ($0.11M)
10.BURBERRY Singapore Distribution Co. PTE LTD – 2% ($0.11M)

Whether for seasoned exporters or new entrants, analyzing Romania's trade flows provides critical insights into global opportunities.
Category
Leave Message for Demo Request or Questions


 T-info
 T-discovery

 My
Tendata
 Market Analysis
 Customer
Development
 Competitor
Monitoring
 Customer Relationship


