 Export News
 2025-11-04
Global exports of zinc ores and concentrates reached US $11.9 billion in 2024.
This figure reflects an average 37.6% increase in the international zinc trade compared with 2020, when global exports were valued at $8.62 billion. On a year-over-year basis, zinc export revenues rose 7.1% from $11.1 billion in 2023.
Zinc is widely used in industry, most prominently as a corrosion-resistant coating for iron and steel (galvanization). It is also an essential ingredient in brass alloys, boosting strength and workability compared to pure copper. Beyond metallurgy, zinc compounds such as zinc oxide are found in rubber manufacturing, paint production, pharmaceuticals, dietary supplements, and even formulas designed to promote weight gain.

Global Trade Overview
In 2024, the five most valuable zinc-exporting nations were Peru, Australia, Bolivia, the United States, and Mexico. Together, they accounted for 56.5% of worldwide zinc export value.
By region, Latin America (excluding Mexico, but including the Caribbean) led global zinc exports with $3.8 billion, representing 31.9% of the total. Europe ranked second with 19.3%, followed by North America (17.2%) and Oceania—dominated by Australia—with 13%.
Asia supplied 10.7%, while African exporters contributed 8%.
The relevant HS code for this commodity is 260800, covering zinc ores and concentrates.
Top Zinc Exporting Countries in 2024
Below are the 25 leading international suppliers of zinc ores and concentrates ranked by export value:
1.Peru – $1.8 billion (15.1%)
2.Australia – $1.54 billion (13%)
3.Bolivia – $1.42 billion (11.9%)
4.United States – $1.38 billion (11.7%)
5.Mexico – $577.1 million (4.9%)
6.Belgium – $563.7 million (4.8%)
7.Sweden – $450.4 million (3.8%)
8.Russia – $442 million (3.7%)
9.Türkiye – $406.1 million (3.4%)
10.Chile – $396.7 million (3.3%)
11.Kazakhstan – $336.1 million (2.8%)
12.South Africa – $294.8 million (2.5%)
13.Eritrea – $277.2 million (2.3%)
14.Portugal – $192.5 million (1.6%)
15.Mongolia – $183.3 million (1.5%)
16.Democratic Republic of the Congo – $128.3 million (1.1%)
17.Italy – $128.3 million (1.1%)
18.Spain – $120.9 million (1%)
19.Finland – $118.1 million (1%)
20.Zambia – $116.4 million (1%)
21.Saudi Arabia – $108.9 million (0.9%)
22.Cuba – $106.7 million (0.9%)
23.Tajikistan – $86.1 million (0.7%)
24.France – $80.8 million (0.7%)
25.Canada – $75.7 million (0.6%)
Together, these 25 nations supplied 95.4% of global zinc exports in 2024.
Fastest-Growing Exporters (2023–2024)
·Saudi Arabia: +115.2%
·Zambia: +57.7%
·Russia: +34.3%
·United States: +33.6%
Largest Declines in Export Value
·Canada: –39.9%
·Portugal: –34.1%
·Belgium: –26.4%
·Mongolia: –16.7%
·France: –15%
Major Zinc-Producing Companies
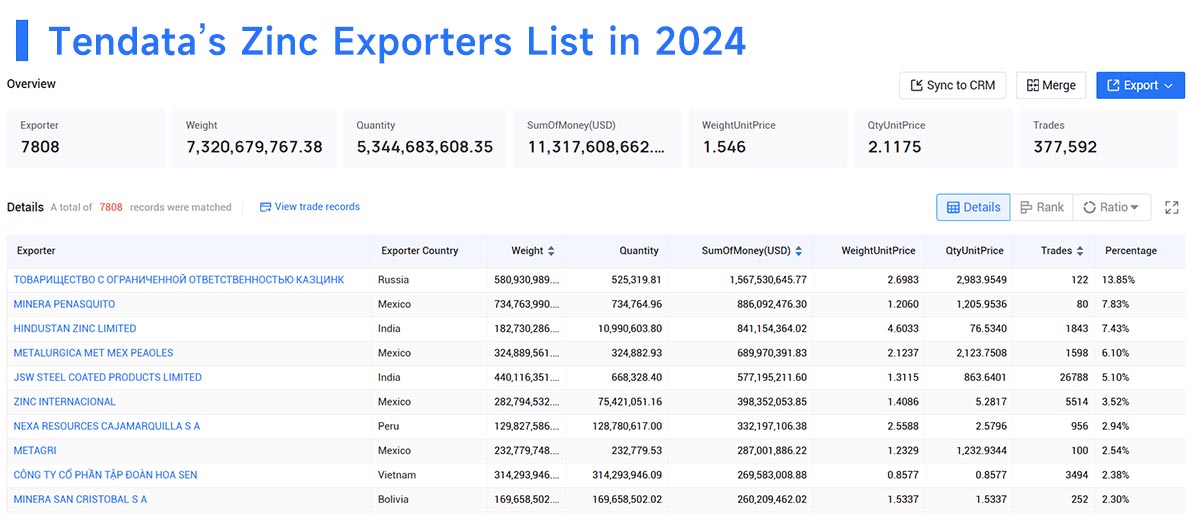
Based on Tendata data, below are 10 major corporate players in 2024 engaged in large-scale zinc production and global trade:
1.ТОВАРИЩЕСТВО С ОГРАНИЧЕННОЙ ОТВЕТСТВЕННОСТЬЮ КАЗЦИНК(13.85%, $1567.53 Million)
2.MINERA PENASQUITO(7.83%, $886.09 Million)
3.HINDUSTAN ZINC LIMITED(7.43%, $841.15 Million)
4.METALURGICA MET MEX PEAOLES(6.1%, $689.97 Million)
5.JSW STEEL COATED PRODUCTS LIMITED(5.1%, $577.2 Million)
6.ZINC INTERNACIONAL(3.52%, $398.35 Million)
7.NEXA RESOURCES CAJAMARQUILLA S A(2.94%, $332.2 Million)
8.METAGRI(2.54%, $287 Million)
9.CÔNG TY CỔ PHẦN TẬP ĐOÀN HOA SEN(2.38%, $269.58 Million)
10.MINERA SAN CRISTOBAL S A(2.3%, $260.21 Million)

Category
Leave Message for Demo Request or Questions


 T-info
 T-discovery

 My
Tendata
 Market Analysis
 Customer
Development
 Competitor
Monitoring
 Customer Relationship


