 Export News
 2025-11-06
Once a British colony and now officially known as the Hong Kong Special Administrative Region of China, Hong Kong exported an estimated US $640.6 billion worth of goods in 2024.
That figure reflects a 16.1% increase from the $551.5 billion recorded in 2020. On a year-over-year basis, Hong Kong's outbound shipments also rose 11.2% from $576.1 billion in 2023.
Based on 2024's average exchange rates, the Hong Kong dollar had weakened slightly by -0.3% against the US dollar compared with December 2020, yet appreciated 0.5% from December 2023 to the end of 2024. This slight currency strengthening means that goods priced in USD became marginally more expensive for global buyers.

Hong Kong's Main Export Destinations
Recent trade statistics show that 86.7% of Hong Kong's total exports were purchased by the following markets:
1. China (Mainland) – 59.1%
2. United States – 6.3%
3. Vietnam – 3.1%
4. India – 3%
5. Taiwan – 2.9%
6. Thailand – 2.7%
7. United Arab Emirates – 2.3%
8. Japan – 1.62%
9. Singapore – 1.6%
10. South Korea – 1.47%
11. Netherlands – 1.4%
12. United Kingdom – 1.3%
By region, Asia absorbed 82.7% of all exports, followed by Europe (8%) and North America (7.3%). Only small shares were sold to Latin America (0.9%), Oceania (0.6%), and Africa (0.56%).
With a population of roughly 7.53 million, Hong Kong's 2024 export total equals about $85,000 per resident, slightly higher than the $83,500 per-capita figure for 2023.
Top 10 Export Categories from Hong Kong (2024)
These categories together represent 93% of Hong Kong's total exports:
1. Electronic integrated circuits & microassemblies – 34.4%
2. Electrical machinery & equipment – 57.6% of total exports
3. Machinery including computers – 14.7%
4. Gems & precious metals (incl. gold) – 14.4%
5. Optical, medical & technical instruments – 2.2%
6. Clocks & watches (including parts) – 1%
7. Plastics & plastic goods – 0.8%
8. Collector items, art & antiques – 0.7%
9. Perfumes & cosmetics – 0.7%
10. Knit or crochet apparel & accessories – 0.5%
Together, these categories accounted for 93% of Hong Kong's total export value.
·Fastest-growing category: Machinery including computers (+29.3% YoY)
·Second-highest growth: Precious metals and gemstones (+13.2%), led largely by gold
·Third place: Electrical machinery (+9.7%)
·Largest decline: Art/antiques/collector goods (-32.7%)
At the 4-digit HTS code level, the most valuable individual exports were:
·Integrated circuits and microassemblies (34.4%)
·Unwrought gold (8.8%)
·Mobile phones including smartphones (8.8%)
Other key exports include computers (5.7%), computer parts (4.4%), solar semiconductors (2.5%), turbojets (2.3%), loose diamonds (1.9%), flat-panel displays (1.9%), and jewelry (1.6%).
Leading Export-Focused Companies in Hong Kong
Businesses entering the Hong Kong export market need reliable supplier intelligence. With Tendata's tools—including HS-code filtering and buyer lookup—companies can quickly locate verified suppliers, review trade history, and obtain contact data, significantly streamlining the sourcing process.
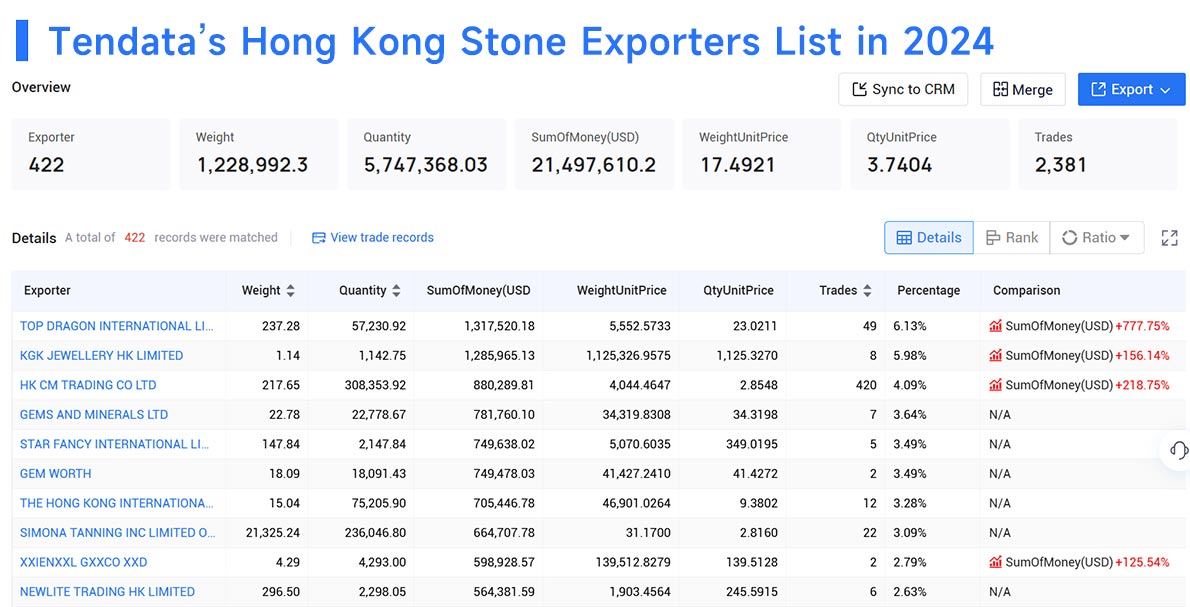
Example: A search for stone-related exports identifies the top 10 Hong Kong suppliers in 2024:
1. TOP DRAGON INTERNATIONAL LIMITED – 6.13% ($1.32M)
2. KGK JEWELLERY HK LIMITED – 5.98% ($1.29M)
3. HK CM TRADING CO LTD – 4.09% ($0.88M)
4. GEMS AND MINERALS LTD – 3.64% ($0.78M)
5. STAR FANCY INTERNATIONAL LIMITED – 3.49% ($0.75M)
6. GEM WORTH – 3.49% ($0.75M)
7. THE HONG KONG INTERNATIONAL DIAMOND GEM AND … – 3.28% ($0.71M)
8. SIMONA TANNING INC LIMITED (for GRACE LINK TRADING LIMITED) – 3.09% ($0.66M)
9. XXIENXXL GXXCO XXD – 2.79% ($0.6M)
10. NEWLITE TRADING HK LIMITED – 2.63% ($0.56M)

Whether you are new to international trade or already active in the market, Hong Kong's export database offers valuable business insights. To access full datasets or request a product demo, contact Tendata.
Category
Leave Message for Demo Request or Questions


 T-info
 T-discovery

 My
Tendata
 Market Analysis
 Customer
Development
 Competitor
Monitoring
 Customer Relationship


