 Export News
 2025-11-06
Armenia, located in Western Asia, exported goods valued at $13 billion globally in 2024.
This marks an impressive 418.5% increase from $2.51 billion in exports in 2020.
In comparison to the previous year, Armenia's export value grew by 55.6% from $8.37 billion in 2023.
In terms of currency exchange, Armenia uses the dram, which has depreciated significantly—by -91.9% since 2020 and -39.3% from 2023 to 2024. This depreciation has made Armenian exports, priced in US dollars, more expensive for buyers using the stronger American currency.

Top Destinations for Armenian Exports
The most recent data shows that a substantial portion of Armenia's exports, around 94.4%, went to the following countries: United Arab Emirates (40.3%), Russia (23.9%), Hong Kong (13.5%), China (8.4%), Iraq (1.9%), Georgia (1.2%), Netherlands (1%), Belgium (0.92%), Belarus (0.88%), Switzerland (0.86%), Iran (0.83%), and Thailand (0.63%).
From a regional perspective, 68.8% of Armenia's exports went to Asia, while 30.6% was delivered to European countries. North America received 0.5% of the exports, and smaller shares were sent to Latin America (0.04%), Africa (0.03%), and Oceania (0.003%).
Given Armenia's population of approximately 2.96 million, its $13 billion in exports in 2024 translates to about $4,400 per person, a significant rise from the $2,800 per capita in 2023.
Top 10 Armenian Export Products
Armenia's leading export product categories in 2024, based on dollar value, were:
1. Gems and precious metals: $8 billion (61.7% of total exports)
2. Electrical machinery and equipment: $1.1 billion (8.2%)
3. Ores, slag, and ash: $923.3 million (7.1%)
4. Tobacco and tobacco substitutes: $437.9 million (3.4%)
5. Beverages, spirits, and vinegar: $390.1 million (3%)
6. Machinery, including computers: $236 million (1.8%)
7. Non-knitted or non-crocheted clothing: $220.8 million (1.7%)
8. Iron and steel: $217.4 million (1.7%)
9. Optical, technical, and medical apparatus: $141.1 million (1.1%)
10. Knit or crochet clothing and accessories: $108.1 million (0.8%)
These top 10 export categories made up a significant 90.5% of Armenia's total export value.
Among the top 10, gems and precious metals saw the most rapid growth, surging by 150.4% from 2023 to 2024, driven mainly by increased gold exports from Armenia.
Tobacco and tobacco substitutes also posted solid growth, rising by 15%, while the export of ores, slag, and ash saw a similar 15% increase.
The biggest drop occurred in iron and steel exports, which saw a decline of -25.3% year-over-year.
Detailed Export Breakdown
At the more detailed 4-digit Harmonized Tariff System (HTS) code level, Armenia's most valuable exports were:
·Unwrought gold: 43% of total exports
·Jewelry: 6.9%
·Phones (including smartphones): 5.2%
·Copper ores and concentrates: 4.3%
·Unwrought silver: 4.2%
·Unmounted diamonds: 3.7%
·Unwrought platinum: 3.4%
·Cigarettes and cigars: 3.1%
·Alcoholic beverages (including spirits): 2.5%
·Television receivers, monitors, and projectors: 2%
Leading Export Companies in Armenia
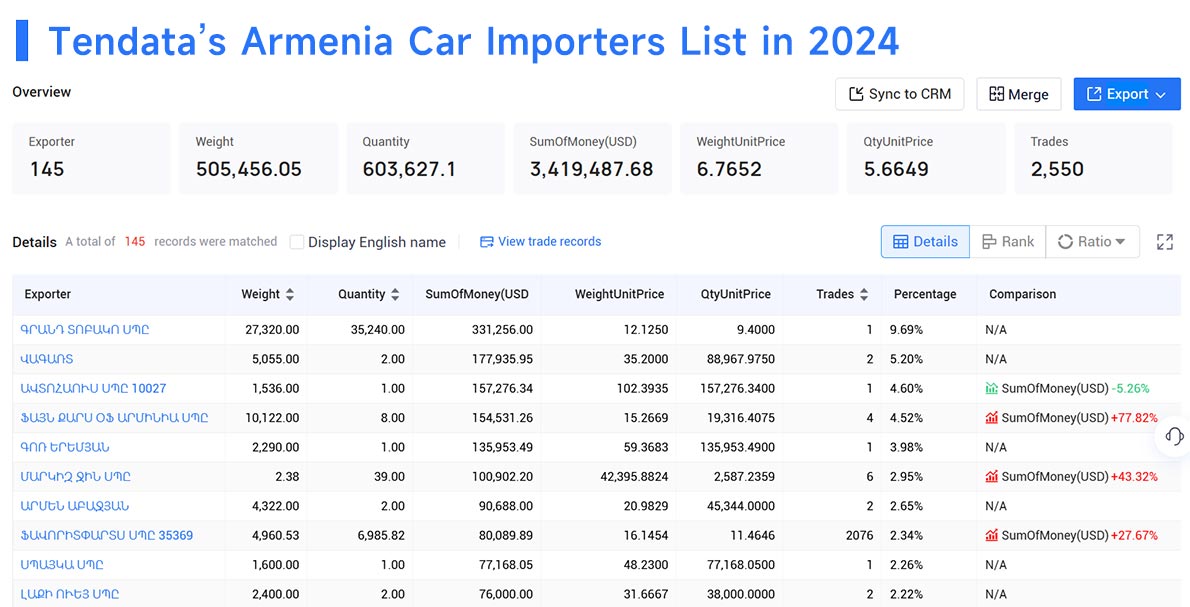
For businesses looking to enter Armenia's export market, identifying reliable suppliers is essential. Tendata's platform offers advanced tools such as keyword search and HS code filters, enabling businesses to quickly identify verified suppliers, monitor purchasing trends, and access contact details.
Here are the top 10 suppliers in Armenia for 2024:
1. Grand Tobacco LLC (9.69%)
2. Vagart (5.2%)
3. Autohaus LLC 10027 (4.6%)
4. Fine Cars of Armenia LLC (4.52%)
5. Gor Yeremyan (3.98%)
6. Markiz Gin LLC (2.95%)
7. Armen Abajian (2.65%)
8. Favoritparts LLC 35369 (2.34%)
9. Spayka LLC (2.26%)
10. Lucky Way LLC (2.22%)

By using this data, businesses can uncover valuable export opportunities in Armenia. For more information on Armenian export statistics or data, contact Tendata for a free online demo.
Category
Leave Message for Demo Request or Questions


 T-info
 T-discovery

 My
Tendata
 Market Analysis
 Customer
Development
 Competitor
Monitoring
 Customer Relationship


