 Export News
 2025-11-05
Located at the crossroads of southwestern Asia and southeastern Europe, Azerbaijan shipped goods valued at US$26.6 billion globally in 2024.
This marks a 93.4% growth from $13.7 billion in 2020. However, compared to the previous year, Azerbaijan's export revenues decreased by 21.7%, falling from $33.9 billion in 2023.
The country's top three exports—crude oil, petroleum gases, and processed petroleum oils—accounted for 87.3% of the total export value. This highlights the nation's heavy reliance on energy-based products for export revenues.
Azerbaijan's Leading Export Markets
In terms of export destinations, 85.5% of Azerbaijani products were shipped to Italy (41%), Türkiye (14.4%), Russia (4.4%), Czech Republic (4.1%), Croatia (3.3%), and several other European and Asian countries.
Looking at the regional distribution:
·71.7% of exports went to Europe,
·26.3% to Asia,
·A small fraction, 1.1%, was sent to Africa.
North America and Latin America accounted for smaller shares of 0.5% and 0.4% respectively, while Oceania (Australia and New Zealand) received just 0.001% of Azerbaijani exports.

Azerbaijan's Top 10 Export Categories in 2024
The following are the key export products from Azerbaijan, ranked by their contribution to total export value:
1. Mineral fuels (including oil) – $23.4 billion (88% of total exports)
2. Fruits & nuts – $497 million (1.9%)
3. Plastics & plastic articles – $368.9 million (1.4%)
4. Precious metals & gems – $215.3 million (0.8%)
5. Cotton – $213.5 million (0.8%)
6. Vegetables – $210.8 million (0.8%)
7. Aluminum – $197.2 million (0.7%)
8. Vehicles – $187.2 million (0.7%)
9. Fertilizers – $127.1 million (0.5%)
10. Organic chemicals – $104.9 million (0.4%)
These top 10 categories made up 96% of Azerbaijan's total export value in 2024.
Fastest-Growing Exports
Among the fastest-growing export categories:
·Fertilizers saw the largest increase, growing by 51.6% from 2023 to 2024.
·Cotton followed with a growth of 30.2%.
·Gems and precious metals experienced a 29% increase, driven by higher gold export revenues.
On the flip side, mineral fuels—Azerbaijan's largest export—experienced a 24.7% decline year-over-year.
Most Valuable Azerbaijani Exports by Product Code
In terms of specific export items, the breakdown is as follows:
·Crude oil represents 54.4% of Azerbaijan's total exports.
·Petroleum gases account for 31.7%, while processed petroleum oils make up 1.3%.
Other significant exports include unwrought gold (0.8%), cotton (0.7%), and fresh fruits (0.7%).
Top Export Companies in Azerbaijan
For businesses aiming to enter Azerbaijan's export market, finding reliable suppliers is crucial. Tendata's platform offers tools such as keyword search and HS code filters to easily identify verified suppliers and access valuable market insights.
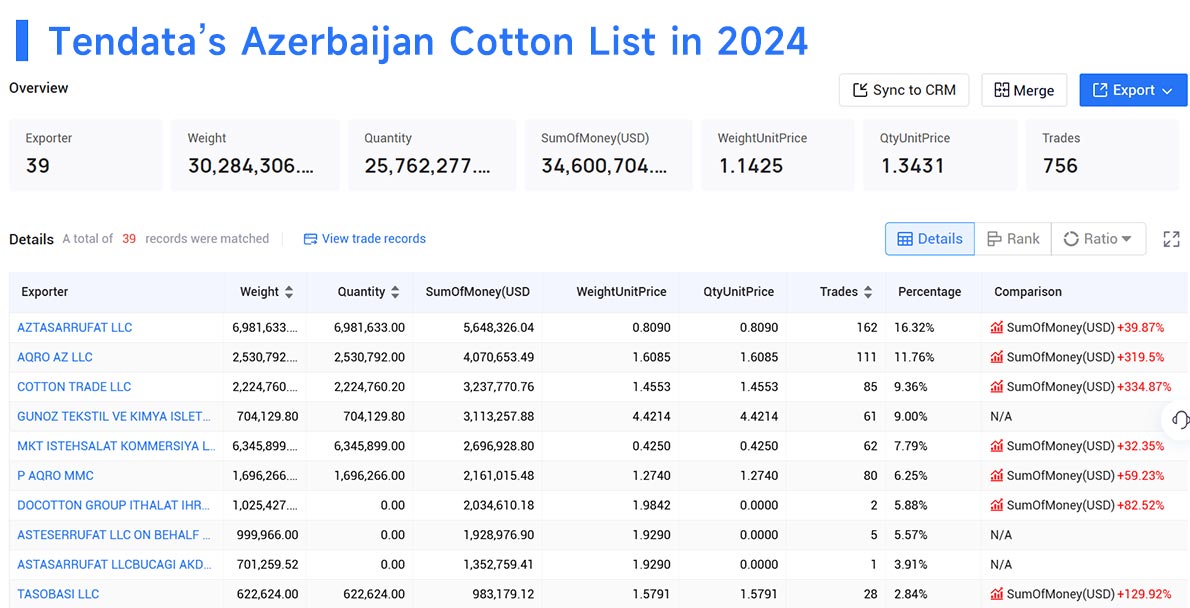
Here are the top 10 suppliers for cotton in Azerbaijan in 2024:
1. AZTASARRUFAT LLC – 16.32%, $5.65M
2. AQRO AZ LLC – 11.76%, $4.07M
3. COTTON TRADE LLC – 9.36%, $3.24M
4. GUNOZ TEKSTIL VE KIMYA ISLETMELERI – 9%, $3.11M
5. MKT ISTEHSALAT KOMMERSIYA LTD – 7.79%, $2.7M
6. P AQRO MMC – 6.25%, $2.16M
7. DOCOTTON GROUP ITHALAT – 5.88%, $2.03M
8. ASTESERRUFAT LLC – 5.57%, $1.93M
9. ASTASARRUFAT LLCBUCAGI AKDENIZ – 3.91%, $1.35M
10. TASOBASI LLC – 2.84%, $0.98M

Conclusion
Azerbaijan's export data reveals numerous opportunities for businesses looking to expand globally. Whether you're a new or experienced trader, accessing Azerbaijan's export trends through platforms like Tendata can provide critical insights and help identify profitable market prospects. To explore more about Azerbaijan's export dynamics or receive a free demo, contact Tendata today.
Category
Leave Message for Demo Request or Questions


 T-info
 T-discovery

 My
Tendata
 Market Analysis
 Customer
Development
 Competitor
Monitoring
 Customer Relationship


