 Export News
 2025-05-06
In 2023, global fertilizer exports generated a total revenue of US$92.7 billion across all exporting nations.
This figure marks a substantial 57.1% growth compared to 2019, when global fertilizer exports were valued at $59 billion. However, on a year-over-year basis, there was a significant decline of 31.3% from $134.9 billion in 2022, reflecting volatility in the fertilizer market.
Fertilizers play a crucial role in global agriculture, enabling higher crop yields and supporting food security across the world.

Top Exporting Countries
The six largest fertilizer exporters in 2023 were:
·Russia
·Mainland China
·Canada
·United States
·Morocco
·Saudi Arabia
Combined, these countries contributed 53.3% of total fertilizer exports worldwide, an increase from 51.6% in 2022.
Regional Distribution of Fertilizer Exports
·Europe led all continents with fertilizer exports totaling $32.8 billion, or 35.4% of global sales.
·Asia followed closely, accounting for 33%.
·North America contributed 16.5%, while Africa made up 12.7%.
·Latin America (excluding Mexico, but including the Caribbean like Trinidad and Tobago) represented 2.1%.
·Oceania, primarily Australia, accounted for the smallest share at 0.3%.
Breakdown by Fertilizer Type
·Nitrogen-based fertilizers dominated exports, making up roughly 73% of total sales.
·Potassic fertilizers accounted for 22.9%.
·Phosphatic fertilizers comprised just 2.8%.
·The remaining 1.2% came from animal or plant-based fertilizers.
All fertilizers are classified under the 2-digit Harmonized Tariff Code 31 for trade purposes.
Countries with the Highest Fertilizer Export Revenues in 2023
Here are the top 20 fertilizer-exporting nations by export value:
1.Russia – $14.9 billion (16.1%)
2.Mainland China – $9.7 billion (10.5%)
3.Canada – $9.6 billion (10.3%)
4.United States – $5.48 billion (5.9%)
5.Morocco – $5.46 billion (5.9%)
6.Saudi Arabia – $4.3 billion (4.7%)
7.Belgium – $2.8 billion (3%)
8.Oman – $2.6 billion (2.8%)
9.Netherlands – $2.59 billion (2.8%)
10.Egypt – $2.5 billion (2.7%)
11.Belarus – $2 billion (2.2%)
12.Israel – $1.95 billion (2.1%)
13.Qatar – $1.82 billion (2%)
14.Jordan – $1.68 billion (1.8%)
15.Spain – $1.56 billion (1.7%)
16.Germany – $1.42 billion (1.5%)
17.Algeria – $1.35 billion (1.5%)
18.Poland – $1.15 billion (1.2%)
19.United Arab Emirates – $1.08 billion (1.2%)
20.Nigeria – $994.7 million (1.1%)
Fastest-Growing Fertilizer Exporters (2022–2023)
Some countries experienced rapid growth in fertilizer export value:
·UAE: +2,639%
·Uzbekistan: +110.6%
·Laos: +31.2%
·Oman: +23.2%
Countries with Major Export Declines
Others saw significant drops in fertilizer export revenue:
·Qatar: -49.2%
·Nigeria: -48.2%
·Vietnam: -45.5%
·Indonesia: -45.1%
·Chile: -45.1%
Key Global Fertilizer Export Companies (2024)
Here are some of the top global corporations involved in fertilizer exports by value:
1.AO Apatit – $1.36 billion (27.3%)
2.AO Uralchem – $348.6 million (7%)
3.EuroChem UKK LLC – $302.2 million (6.07%)
4.Fertpoint LLC – $241.6 million (4.85%)
5.Vector LLC – $234.3 million (4.71%)
6.AHPP LLC – $221.2 million (4.44%)
7.Agrokaliy LLC – $205.9 million (4.14%)
8.UzKimyoImpeks – $174.5 million (3.51%)
9.Kazphosphate LLP – $143.1 million (2.87%)
10.EuroChem MHK AO – $105.5 million (2.12%)

Expand Your Global B2B Customers Leads with Tendata
Tendata provides comprehensive global trade data covering 228+ countries and regions, including key markets such as Indonesia, India, Turkey, Malaysia, and beyond. Gain deep insights into global market dynamics, uncover hidden demand and growth opportunities, and efficiently connect with decision-makers to expand your international client base. Discover your next growth curve in global trade with ease!
Using Tendata, we identify active Indonesia importers with recent trade records over the past year.
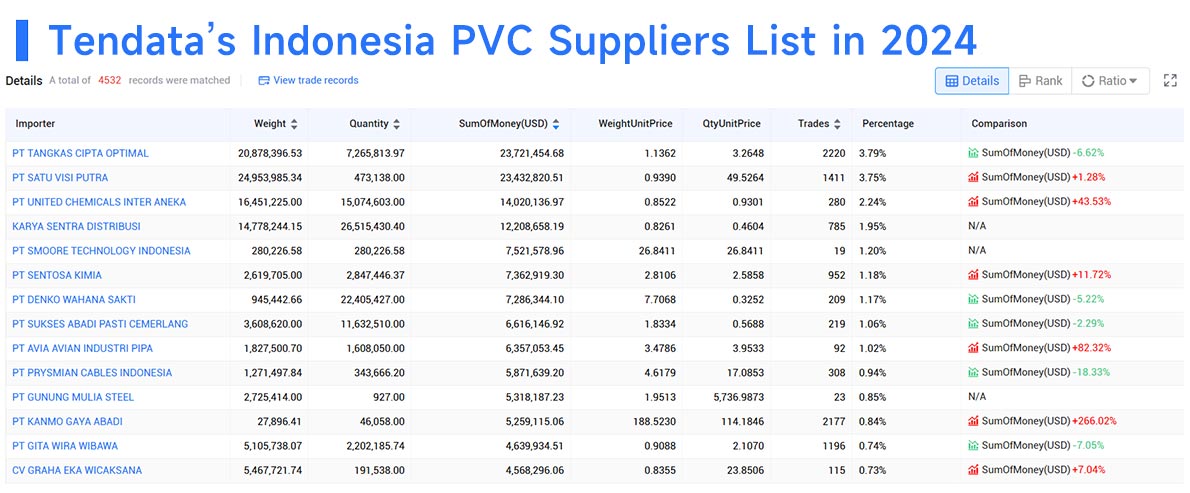
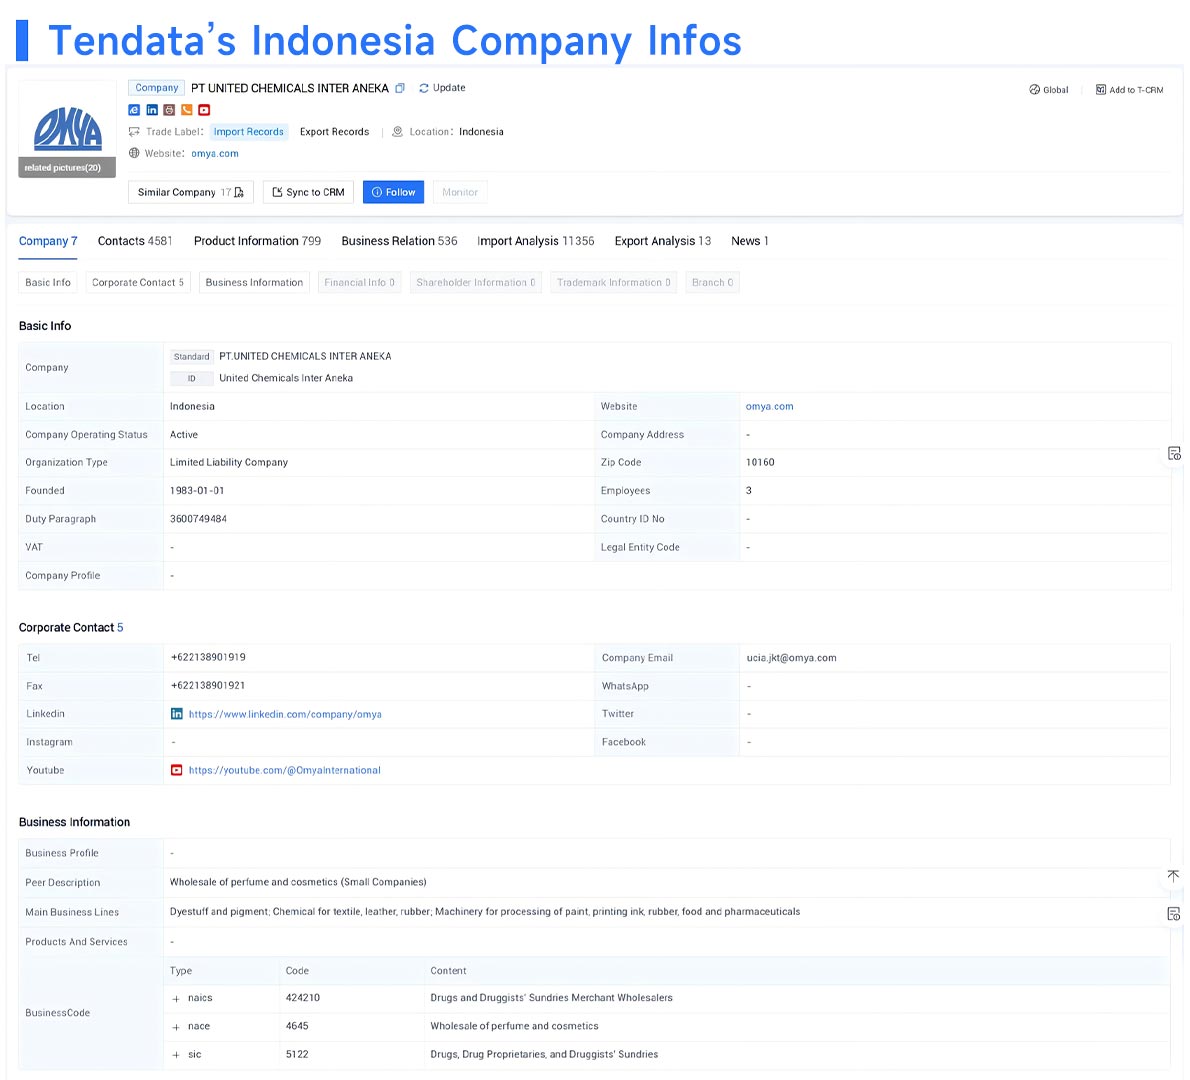
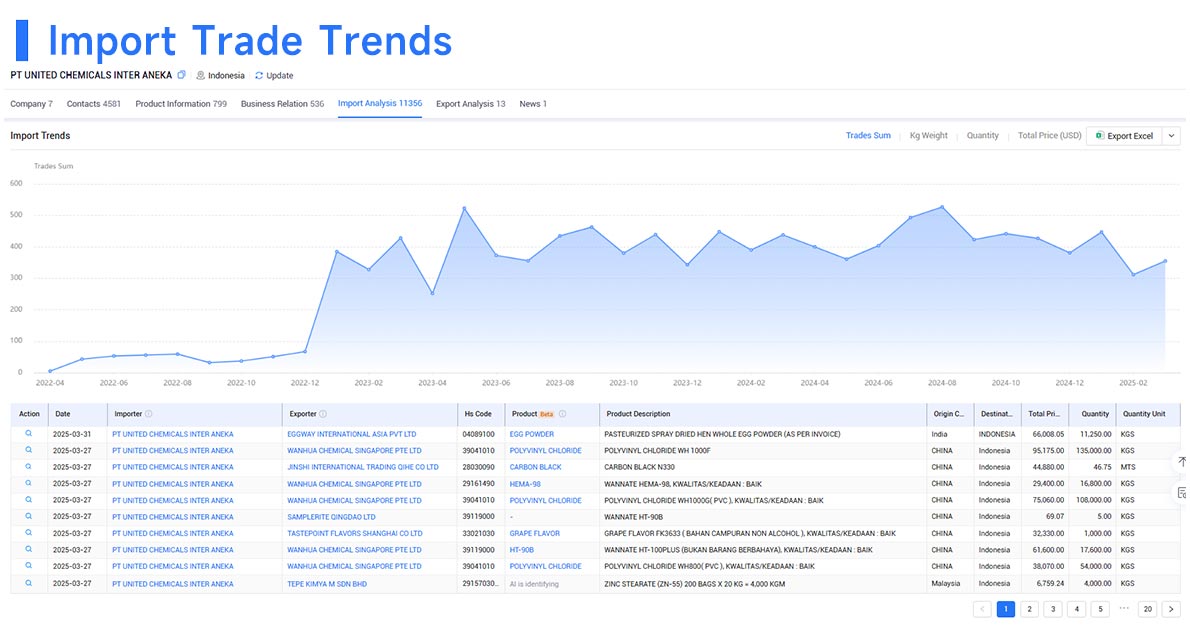
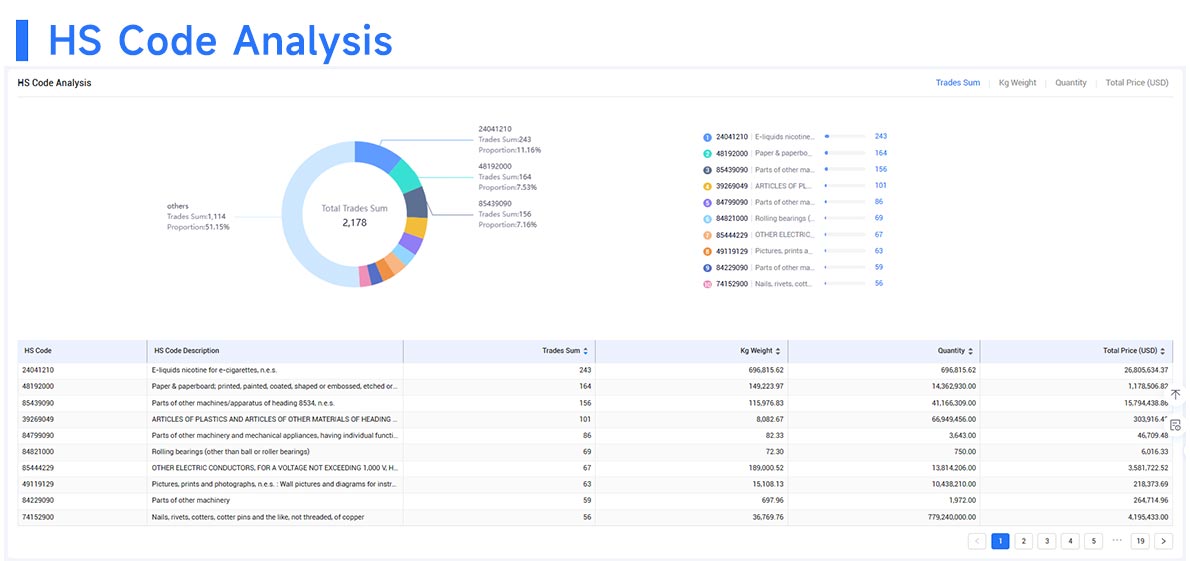
For each potential client, we provide a detailed analysis of their import history, HS codes, suppliers, supply chain networks, and regions. This enables you to assess their purchasing power and development potential, helping you pinpoint the optimal timing and entry strategy for engagement — paving the way for successful partnerships.
Stay Ahead of the Competition
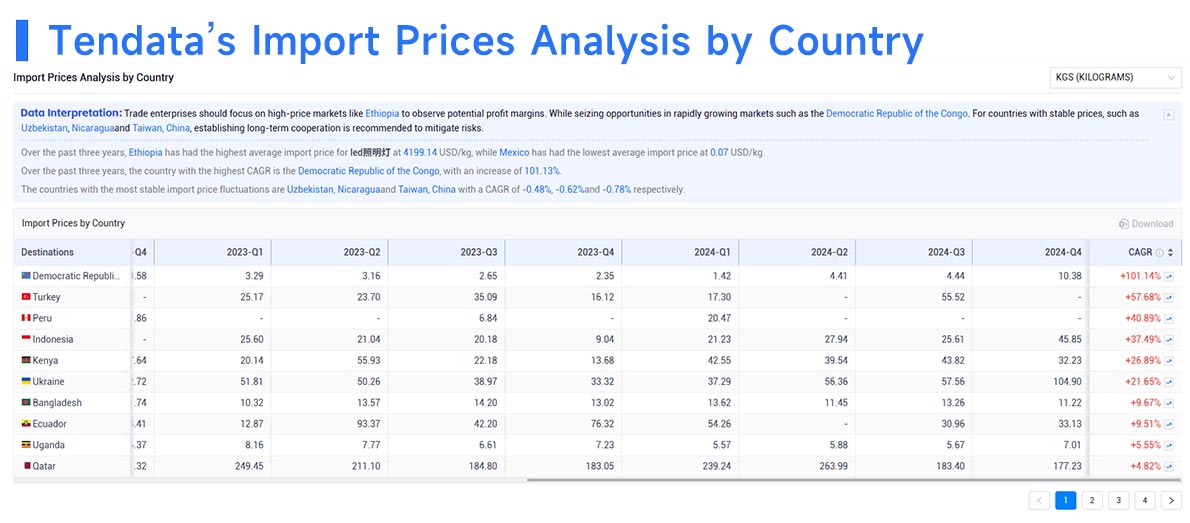
Tendata also helps you monitor competitor activities, market performance, and pricing strategies. Adjust your offerings flexibly and maintain a strategic advantage in even the most competitive environments.
Connect Directly with Decision-Makers
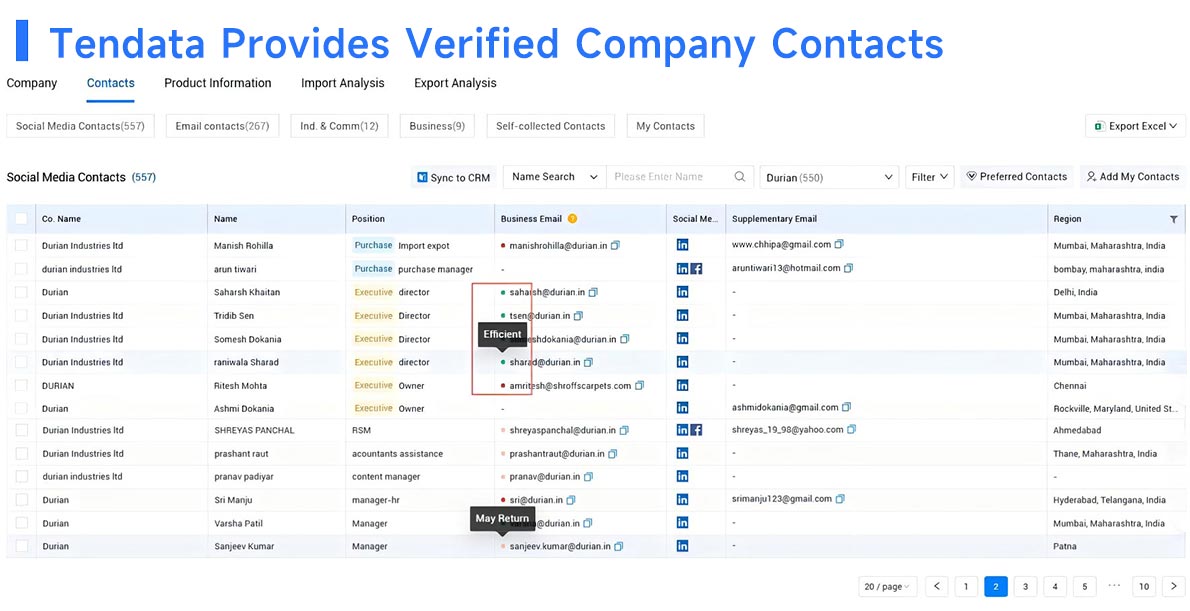
Through Tendata's integrated contact database, you can easily access detailed profiles of key personnel such as buyers and executives, complete with email addresses and links to LinkedIn, Facebook, and other major platforms. Our system enables seamless connection with your targets through trusted professional networks.
Category
Leave Message for Demo Request or Questions


 T-info
 T-discovery

 My
Tendata
 Market Analysis
 Customer
Development
 Competitor
Monitoring
 Customer Relationship


