 Export News
 09-06-2025
In 2024, the international market for fresh apple exports reached a total value of US$7.695 billion.
Compared to 2020’s figure of $7.691 billion, the overall export value remained essentially unchanged, posting only a modest 0.1% increase over the five-year period.
On an annual basis, international sales of fresh apples increased by 7.9%, rising from $7.13 billion in 2023.
The top five apple-exporting nations—Italy, the United States, China, New Zealand, and Chile—accounted for nearly 57.6% of the world’s total exports in 2024, showing a strong concentration of supply among a few key players.
Looking at exports by continent, Europe led the way with shipments valued at $2.96 billion, representing 38.5% of total international sales.
Asia came next, contributing 23%, followed by North America with 14.8%.
Exporters from Latin America (excluding Mexico but including the Caribbean) supplied 8.4%, just ahead of Oceania—largely New Zealand—at 7.8%. Africa, meanwhile, accounted for 7.5% of international apple exports.
The Harmonized Tariff System (HTS) code for fresh apples is 080810.

Top Apple Exporting Countries in 2024
These were the 15 leading apple-exporting nations by value:
1.Italy: $1.12B (14.5%)
2.United States: $1.09B (14.1%)
3.China: $1.05B (13.6%)
4.New Zealand: $597.2M (7.8%)
5.Chile: $582.2M (7.6%)
6.South Africa: $577.4M (7.5%)
7.Poland: $509.9M (6.6%)
8.France: $470.4M (6.1%)
9.Türkiye: $192.2M (2.5%)
10.Netherlands: $177.2M (2.3%)
11.Japan: $133.1M (1.7%)
12.Iran: $132.2M (1.7%)
13.Serbia: $113.6M (1.5%)
14.Spain: $104.3M (1.4%)
15.Belgium: $82.8M (1.1%)
Together, these 15 countries accounted for 90% of all international apple exports in 2024.
Strong Performers and Decliners
Among the top exporters, the most notable growth came from:
·Chile: +20.8%
·South Africa: +18.6%
·Poland: +17.5%
·United States: +16.6%
Only one major exporter recorded a sharp decline in shipments—though the name isn't specified, the decrease was a significant -58.1% from 2023.
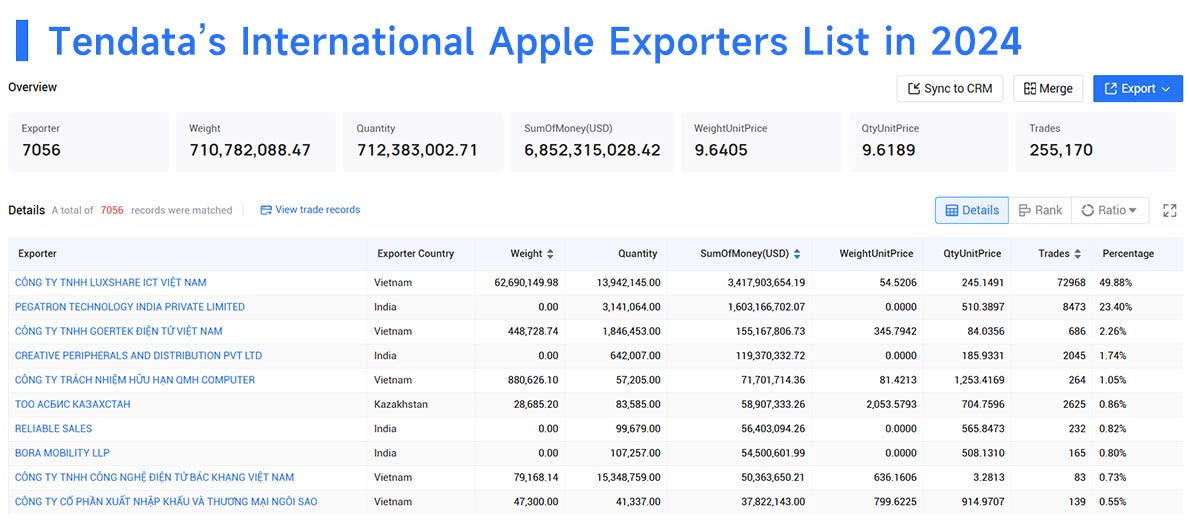
Major Apple Export Companies (2024)
Based on Tendata global trade data
1.Luxshare ICT Vietnam Co., Ltd. – $3.42B (49.88%)
2.Pegatron Technology India Pvt Ltd – $1.6B (23.4%)
3.Goertek Electronics Vietnam Co., Ltd. – $155.17M (2.26%)
4.Creative Peripherals & Distribution Pvt Ltd – $119.37M (1.74%)
5.QMH Computer Co., Ltd. – $71.7M (1.05%)
6.ASBIS Kazakhstan LLP – $58.91M (0.86%)
7.Reliable Sales – $56.4M (0.82%)
8.Bora Mobility LLP – $54.5M (0.8%)
9.Bac Khang Electronics Vietnam Co., Ltd. – $50.36M (0.73%)
10.Ngoi Sao Import-Export and Trading JSC – $37.82M (0.55%)

Tendata can help you quickly acquire a large number of potential customers, and also understand the key information of target customers such as purchase frequency, purchase volume, purchase cycle, etc., and analyze the purchase habits and actual needs of potential customers.
On the basis of analyzing and evaluating your own products, you also need to study the products of your competitors. Through comparison and analysis, find out the advantages and disadvantages of your own products and find the market gap, so that you can better understand the dynamics and changes of the market.
Tendata not only has powerful analysis functions, but also comes with a contact database. With just one click, you can view the detailed information of key decision makers such as purchasers and executives, including their emails, LinkedIn and Facebook social accounts. What's more convenient is that the platform also directly links to the world's mainstream social media platforms such as LinkedIn, providing a convenient channel for companies to quickly establish contact with target objects.
>>Request A Free Demo from Tendata<<

Category
Leave Message for Demo Request or Questions


 T-info
 T-discovery

 My
Tendata
 Market Analysis
 Customer
Development
 Competitor
Monitoring
 Customer Relationship


