 Export News
 2025-06-13
Uranium, a silvery-white metal known for its radioactivity and distinctive nuclear attributes, plays a crucial role both in military applications—notably as a high-density penetrator—and in civilian energy production as a nuclear reactor fuel.
In 2024, global uranium exports reached a total value of approximately US$19.6 billion, marking a substantial 250.8% increase compared to $5.6 billion in 2020.
On a year-over-year basis, uranium export revenues jumped by 47.3%, up from $13.3 billion in 2023.
Main Categories of Exported Uranium
There are three primary forms of uranium traded internationally, each classified under the 6-digit Harmonized Tariff System (HTS) codes:
·Natural Uranium and Compounds: HTS code 284410
·Enriched Uranium: HTS code 284420
·Depleted Uranium: HTS code 284430
Natural Uranium
Shipments of natural uranium amounted to $9.3 billion in 2024, representing a 202% rise from 2020 levels. From 2023 to 2024, the export value of natural uranium soared by 63.3%.
Enriched Uranium
Enriched uranium exports climbed to $10.2 billion, reflecting a 315.2% surge over 2020 and a 35.5% year-on-year growth.
Depleted Uranium
Exports of the smallest category, depleted uranium, brought in $91.5 million, which is up 91.5% from 2020 and 21.3% higher than in 2023.

Top Exporters of Natural Uranium (2024)
The following 15 countries led the world in natural uranium export value:
1.Kazakhstan: $4.5 billion (48.8%)
2.Canada: $3.3 billion (35.6%)
3.United States: $963.2 million (10.4%)
4.Niger: $239.5 million (2.6%)
5.Ukraine: $78.3 million (0.8%)
6.South Africa: $58.6 million (0.63%)
7.France: $58.3 million (0.63%)
8.Russia: $44.8 million (0.5%)
9.Germany: $4.4 million (0.05%)
10.Netherlands: $2.4 million (0.03%)
11.United Kingdom: $188,000 (0.002%)
12.Indonesia: $164,000 (0.002%)
13.Switzerland: $56,000 (0.0006%)
14.Israel: $44,000 (0.0005%)
15.Belgium: $5,000 (0.0001%)
Combined, these nations were responsible for an overwhelming 99.9999% of global natural uranium exports in 2024.
Fastest-Growing Exporters
The most significant year-over-year increases in 2024 came from:
·France: +9,842%
·Switzerland: +273%
·United States: +223.4%
·Ukraine: +189.6%
·Notable Decline
Russia was the only major exporter to experience a downturn, with a 28.9% decline in its natural uranium shipments compared to the previous year.
Leading Exporters of Enriched Uranium in 2024
In 2024, the global trade in enriched uranium was dominated by the following 15 countries, ranked by export value:
1.France led with $3.1 billion, accounting for 30.1% of total enriched uranium exports.
2.Russia followed at $2.8 billion (27.4%).
3.Netherlands contributed $2.4 billion (23.7%).
4.Germany shipped $1.3 billion (12.6%).
5.Mainland China exported $545 million (5.3%).
6.United States: $39 million (0.4%).
7.Spain: $22 million (0.2%).
8.Kazakhstan: $13.2 million (0.13%).
9.Sweden: $9.9 million (0.10%).
10.United Kingdom: $323,000 (0.003%).
11.Belgium: $38,000 (0.0004%).
12.Canada: $21,000 (0.0003%).
Together, these exporters represented 100% of global enriched uranium shipments in 2024.
Spain saw the most dramatic increase (up 20,040%), Followed by the UK (up 412.7%), Netherlands (up 95%), And France (up 66%).
Notably, exports fell in: United States (down -41%), Kazakhstan (down -34.8%), And Sweden (down -27.7%).
Top Depleted Uranium Exporters in 2024
Here are the 15 countries that shipped the highest values of depleted uranium during 2024:
1.South Africa led with $66.7 million (72.5%).
2.United States: $12.2 million (13.3%).
3.Sweden: $6.3 million (6.8%).
4.Portugal: $1.7 million (1.8%).
5.Australia: $1.5 million (1.6%).
6.Czech Republic: $883,000 (1%).
7.Canada: $598,000 (0.7%).
8.Spain: $408,000 (0.44%).
9.Netherlands: $330,000 (0.36%).
10.India: $280,000 (0.3%).
11.France: $220,000 (0.24%).
12.Estonia: $158,000 (0.17%).
13.Malaysia: $120,000 (0.13%).
14.Greece: $118,000 (0.13%).
15.Switzerland: $109,000 (0.12%).
Combined, these nations were responsible for 99.6% of all global depleted uranium exports by value in 2024.
Fastest-Growing Exporters
The biggest year-over-year increases were seen in:
·Portugal (up 41,725%)
·Canada (up 406.8%)
·Switzerland (up 186.8%)
·Australia (up 175.5%)
Declining Exporters
Countries experiencing declines included:
·Malaysia (down -72.7%)
·France (down -60.3%)
·Greece (down -51.4%)
·Sweden (down -38.9%)
·Spain (down -33.2%)
Key Global Uranium Exporters (2024)
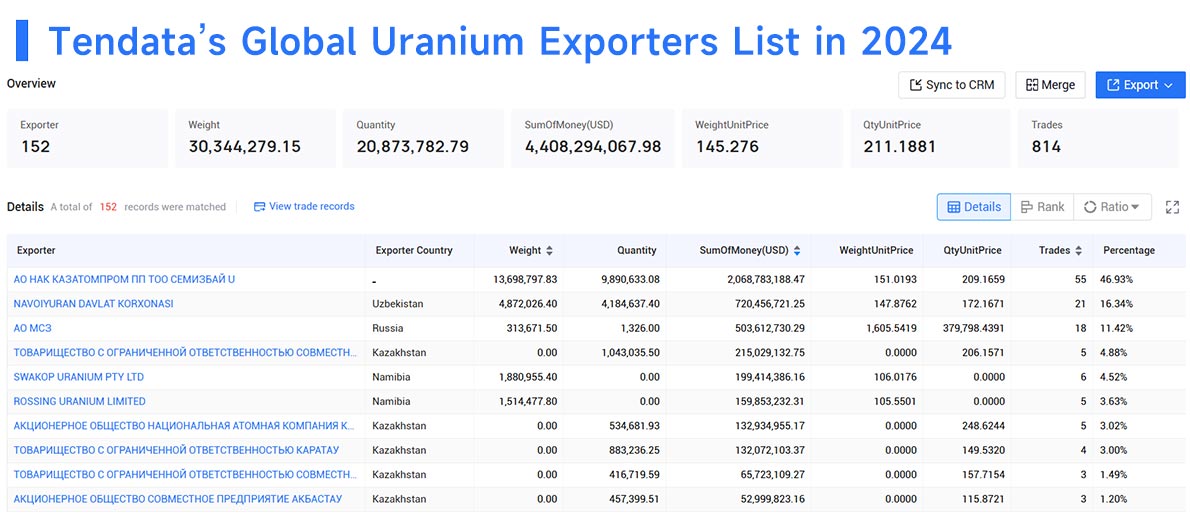
Based on data from Tendata, these are the top 10 companies engaged in uranium exports worldwide:
1.АО НАК Казатомпром ПП ТОО Семизбай U – 46.93% share, $2.07 billion
2.Navoi Mining & Metallurgy Combinat – 16.34%, $720.5 million
3.АО МСЗ (MSZ JSC) – 11.42%, $503.6 million
4.Южная Горная Химическая Компания (South Mining Chemical Company) – 4.88%, $215 million
5.Swakop Uranium Pty Ltd – 4.52%, $199.4 million
6.Rossing Uranium Limited – 3.63%, $159.9 million
7.АО Казатомпром (Kazatomprom JSC) – 3.02%, $132.9 million
8.Каратау LLP – 3%, $132.1 million
9.СП Буденовское (Budennovskoye JV LLP) – 1.49%, $65.7 million
10.СП Акбастау (Akbastau JV JSC) – 1.2%, $53 million

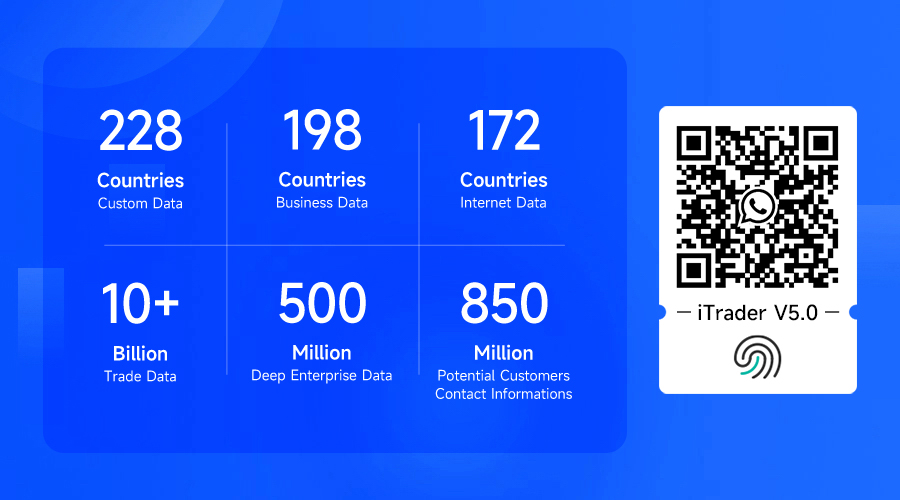
Trade Data: Tendata has accumulated 10 billion+ trade transaction details from 228+ countries and regions, supporting one-click query of major import and export countries, customer distribution, product volume and price, etc., which helps import and export enterprises to accurately understand the global market and the trade environment of the target market.
Business Data: Tendata has a total of 500 million+ in-depth enterprise data, involving 198 countries and 230+ industry segments, covering the current operation status, financial information, product information, business relationships, intellectual property rights, etc. The data is fine, which makes it easy to assess the real strength of the target customers in depth, and expand the potential customer base.
Internet Data: Tendata's total of 850 million+ contact data, integrating social media, emails and other multi-channel contacts, helps to reach key contacts of enterprises with one click and improve the efficiency of customer development, as well as news and public opinion monitoring, which helps to grasp the Internet information in a timely manner.

Category
Leave Message for Demo Request or Questions


 T-info
 T-discovery

 My
Tendata
 Market Analysis
 Customer
Development
 Competitor
Monitoring
 Customer Relationship


