 Import News
 2025-08-14
In 2024, global purchases of imported natural rubber totaled US $16.9 billion.
Compared to 2020, when worldwide natural rubber imports were valued at $12.5 billion, the market expanded by 34.7% over five years. On a year-over-year basis, spending on imported natural rubber surged 18.8% from $14.2 billion in 2023.
The five largest importing countries—Mainland China, the United States, Malaysia, Japan, and India—together accounted for nearly 57.8% of all international purchases. This high concentration reflects the dominance of a small group of populous nations in the global natural rubber market.
Asian countries led the world in natural rubber purchases in 2024, importing goods worth $10.8 billion, or 63.6% of the global total. Europe ranked second with 18.9%, followed by North America with 13.6%.
Smaller market shares went to Latin America (2.7%, excluding Mexico but including the Caribbean), Africa (1%), and Oceania (0.1%), led by Australia and New Zealand.
For classification, natural rubber and similar gums in primary form—including balata, gutta-percha, guayule, and chicle—fall under the Harmonized Tariff System (HTS) code 4001.
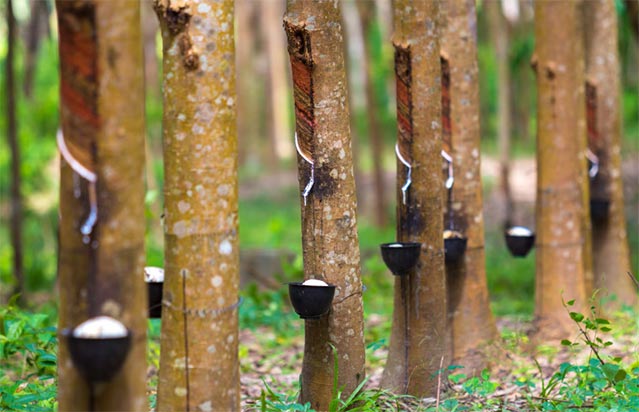
Top 15 Importing Countries in 2024
The countries importing the highest dollar value of natural rubber in 2024 were:
1.Mainland China – $4 billion (23.4% of total)
2.United States – $1.8 billion (10.8%)
3.Malaysia – $1.7 billion (9.8%)
4.Japan – $1.3 billion (7.5%)
5.India – $1.1 billion (6.3%)
6.Vietnam – $779.1 million (4.6%)
7.South Korea – $585.9 million (3.5%)
8.Türkiye – $493.3 million (2.9%)
9.Germany – $455 million (2.7%)
10.Spain – $355.4 million (2.1%)
11.Brazil – $280.3 million (1.7%)
12.Italy – $259.6 million (1.5%)
13.Mexico – $247 million (1.5%)
14.Canada – $233.1 million (1.4%)
15.Belgium – $229.3 million (1.4%)
Together, these 15 countries were responsible for 81% of all natural rubber imports in 2024.
Market Growth Trends
Between 2023 and 2024, the fastest-growing import markets for natural rubber were:
·India (+48.5%)
·South Korea (+42.4%)
·Malaysia (+32.2%)
·Japan (+31.1%)
Vietnam was the only top importer to register a decline, with a -34.1% drop in purchases.
Major Natural Rubber Importing Companies
According to Tendata trade intelligence, the top natural rubber importers worldwide in 2024 included:
1.MRF LIMITED(5.88%, $1759.08 Million)
2.APOLLO TYRES LIMITED(1.97%, $591.25 Million)
3.TIRE DIRECT(1.7%, $510.29 Million)
4.JK TYRE AND INDUSTRIES LIMITED(1.57%, $469.21 Million)
5.BALKRISHNA INDUSTRIES LIMITED(1.44%, $432.05 Million)
6.CEAT LTD(1.43%, $428.09 Million)
7.CÔNG TY TNHH SAILUN VIỆT NAM(1.17%, $351.76 Million)
8.CÔNG TY TNHH TIẾN THÀNH(1.03%, $308.01 Million)
9.CÔNG TY CỔ PHẦN HÓA DẦU MEKONG(0.91%, $272.72 Million)
10.BRIDGESTONE DE MEXICO(0.78%, $233.72 Million)
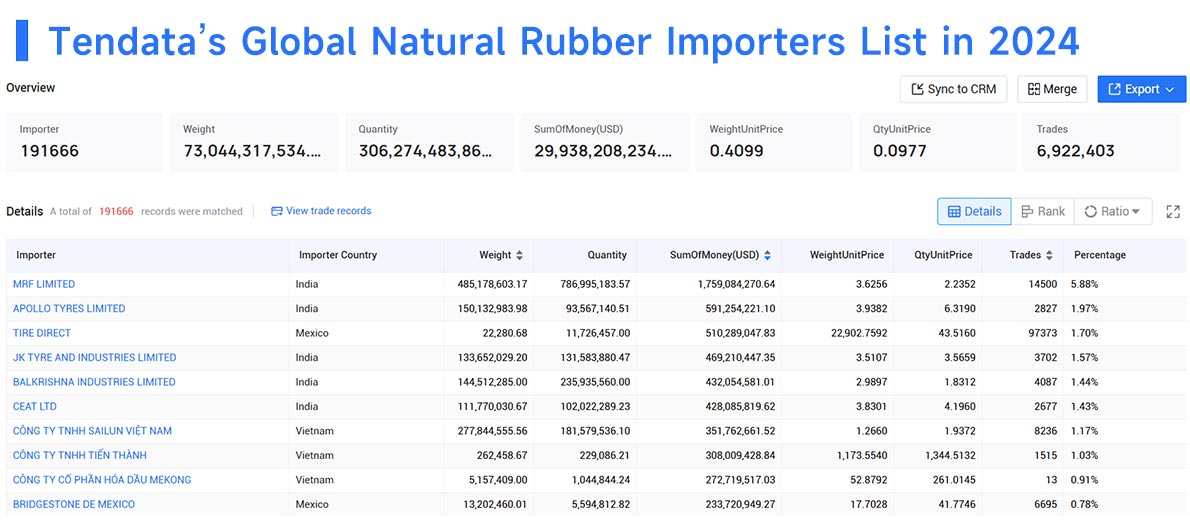
How to find Natural Rubber Importers through Tendata Natural Rubber Import Data?
Through Tendata, we screened the list of active buyers with purchasing records in the past year.
For the target customers, in-depth understanding of their company's import trade records, HS codes, suppliers, supply chain, import regions, etc., to assist in analyzing the purchasing power and sustainability of buyers, to determine the development value of the customer; with these trade records, we can look for the right time to enter and point of entry, and more smoothly with the customer ice-breaking communication, to lay the foundation for the final cooperation.
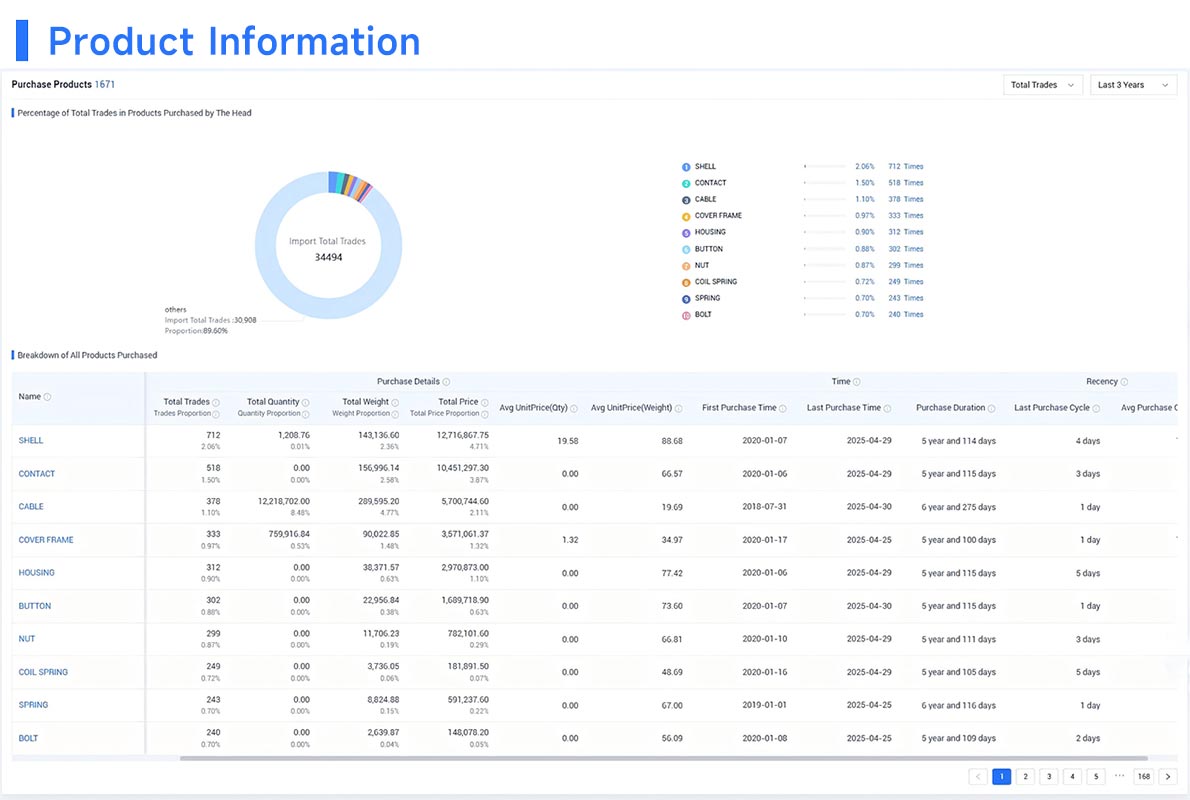
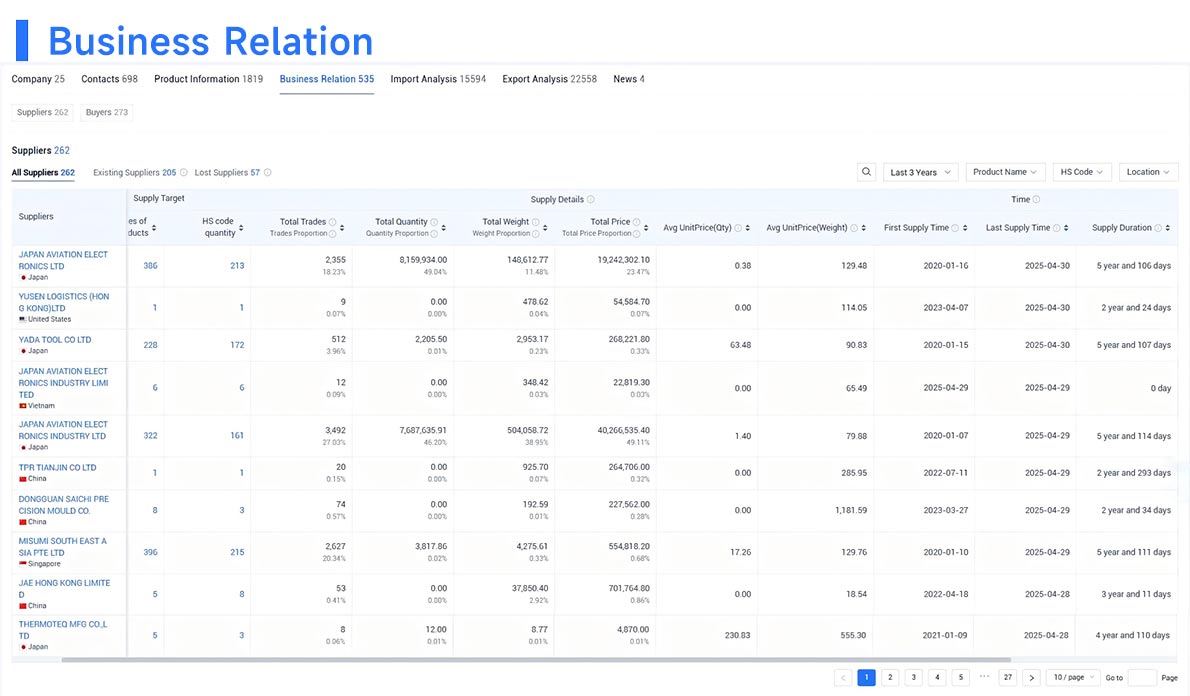
Image source: Tendata
Tendata also provides customer contact information. By clicking on the "Contacts" section, you can view the details of key decision makers such as purchasers and executives, including their email addresses and social accounts such as LinkedIn and Facebook. This approach helps us to quickly reach out to our customers and increase our customer development efficiency.
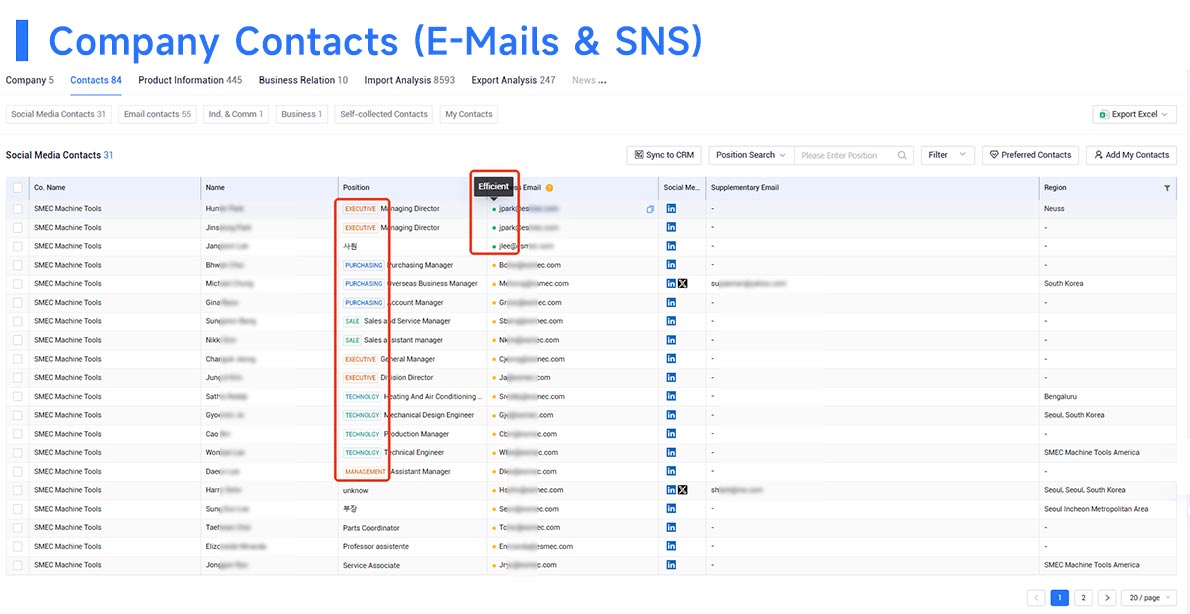
Image source: Tendata
Category
Leave Message for Demo Request or Questions


 T-info
 T-discovery

 My
Tendata
 Market Analysis
 Customer
Development
 Competitor
Monitoring
 Customer Relationship


