 Import News
 2025-08-26
In 2024, Indonesia brought in products worth US$233.7 billion from international suppliers. This represents a 65% surge compared with the $141.6 billion recorded in 2020.
On a yearly basis, import growth moderated to 5.4%, rising from $221.7 billion in 2023.
From a currency perspective, the Indonesian rupiah lost about -4.1% of its value against the US dollar between 2023 and 2024. As a result, imports priced in stronger US dollars became more costly when converted into local currency.
Domestically, consumer inflation averaged 2.484% in 2024, easing from 3.713% in 2023.

Key Sources of Indonesia's Imports
According to the most recent trade data, 78.4% of Indonesia's imports came from a dozen major partners. The largest suppliers were:
1.China (31.1%)
2.Singapore (9.2%)
3.Japan (6.4%)
4.United States (5.1%)
5.Malaysia (4.7%)
6.Australia (4.5%)
7.Thailand (4.2%)
8.South Korea (4%)
9.Vietnam (2.8%)
10.India (2.4%)
11.Brazil (2.3%)
12.Saudi Arabia (1.7%)
Looking by region, Asia accounted for 73.7% of total imports. European countries delivered 7.7%, while North America supplied 6.2%. Smaller contributions came from Oceania (5.1%), Africa (4%), and Latin America (3.2%) excluding Mexico but including the Caribbean.
With a population of about 281.6 million, Indonesia's import spending works out to $830 per person in 2024, up from $800 per capita in 2023.
Indonesia's Top 10 Imported Products in 2024
The following categories ranked as Indonesia's most significant imports, listed with their total values and share of overall imports:
1.Mineral fuels including oil: $40.7B (17.4%)
2.Machinery including computers: $33.5B (14.3%)
3.Electrical machinery & equipment: $27B (11.6%)
4.Iron & steel: $10.7B (4.6%)
5.Plastics & plastic items: $10.6B (4.5%)
6.Vehicles: $9.7B (4.1%)
7.Organic chemicals: $7.1B (3%)
8.Cereals: $6.8B (2.9%)
9.Gems & precious metals: $4.8B (2%)
10.Optical, technical & medical equipment: $4.4B (1.9%)
Together, these ten categories represented about 66.4% of all imports into Indonesia.
The fastest-growing import segments from 2023 to 2024 were:
·Gems & precious metals (+70.9%), particularly gold
·Optical/medical instruments (+9.1%)
·Cereals (+1.8%), especially rice
By contrast, iron & steel (-6.3%) and vehicles (-5.3%) recorded declines.
At a more detailed HS 4-digit level, the leading imported products were:
1.Processed petroleum oils (9.2%)
2.Crude oil (4.4%)
3.Mobile phones (2.8%)
4.Unwrought gold (2%)
5.Integrated circuits & microassemblies (1.7%)
6.Petroleum gases (1.6%)
7.Computers & optical readers (1.6%)
8.Wheat (1.6%)
9.Coal and solid fuels from coal (1.6%)
10.Auto parts & accessories (1.4%)
Indonesia's Top Importing Companies (2024)
For businesses exploring Indonesia's market, identifying trusted buyers is key. Platforms like Tendata allow users to filter by HS codes and keywords, giving instant access to thousands of verified customers, purchasing patterns, and direct contact details—streamlining entry into the Indonesian market.
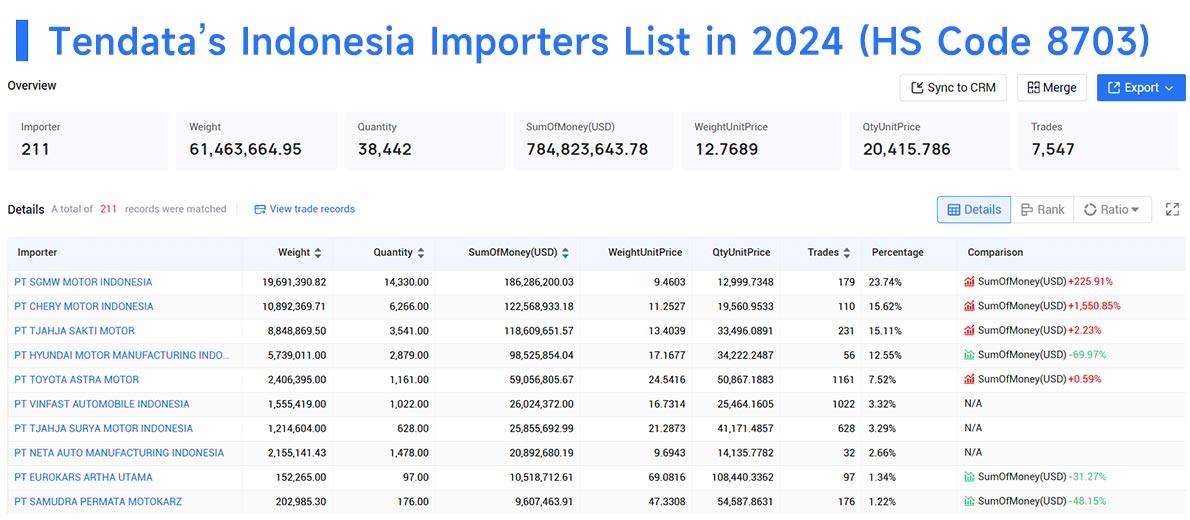
For example, using HS Code 8703 (vehicles), the top 10 buyers in 2024 were:
1.PT SGMW Motor Indonesia (23.74%, $186.29M)
2.PT Chery Motor Indonesia (15.62%, $122.57M)
3.PT Tjahja Sakti Motor (15.11%, $118.61M)
4.PT Hyundai Motor Manufacturing Indonesia (12.55%, $98.53M)
5.PT Toyota Astra Motor (7.52%, $59.06M)
6.PT VinFast Automobile Indonesia (3.32%, $26.02M)
7.PT Tjahja Surya Motor Indonesia (3.29%, $25.86M)
8.PT Neta Auto Manufacturing Indonesia (2.66%, $20.89M)
9.PT Eurokars Artha Utama (1.34%, $10.52M)
10.PT Samudra Permata Motokarz (1.22%, $9.61M)
>>Get A Free Demo via Tendata<<

Whether you're an established trader or just entering the market, using Indonesian import statistics can highlight new opportunities. For deeper insights, Tendata offers free demo access to its import data tools.
Category
Leave Message for Demo Request or Questions


 T-info
 T-discovery

 My
Tendata
 Market Analysis
 Customer
Development
 Competitor
Monitoring
 Customer Relationship


