 Import News
 2025-11-06
Denmark, located to the southwest of Sweden, imported goods worth a total of $123.2 billion in 2024.
This total represents a 28.6% increase compared to the $95.8 billion spent on imports in 2020.
From 2023 to 2024, the growth rate of imports slowed to just a 2.5% increase, from $120.2 billion the year before.
Due to fluctuations in the exchange rate, the Danish krone weakened slightly by -0.05% against the US dollar from 2023 to 2024. This depreciation of the local currency made imported products more expensive when converted from krone to dollars.

Denmark's Main International Suppliers
Recent data highlights that the largest share of Denmark's imports comes from countries such as Germany (15.7%), Sweden (11.5%), the Netherlands (6.9%), China (6.5%), the United States (5.7%), Poland (5.6%), Norway (4.1%), Italy (3.6%), Belgium (3.5%), France (2.5%), the UK (2.1%), and South Korea (2%).
When viewed by continent, Europe supplies the majority of Denmark's imports, accounting for 75.7% of the total value, followed by Asia with 16.2%.
Denmark has been part of the European Union since 1973, and EU member states accounted for 67.4% of its imports in 2024.
Imports from North America contributed 6.3%, from Latin America 1.1% (excluding Mexico but including the Caribbean), Africa 0.5%, and Oceania 0.3% (mainly from the Marshall Islands, Australia, and New Zealand).
Considering Denmark's population of approximately 5.95 million, the country's import spending per person in 2024 was about $20,700. This marks a slight drop from the $21,400 per capita in 2023.
Denmark's Top 10 Imported Goods
The top imported goods in Denmark in 2024 were:
1. Machinery (including computers): $13.5 billion (11% of total imports)
2. Vehicles: $11.8 billion (9.6%)
3. Electrical machinery and equipment: $11.8 billion (9.6%)
4. Mineral fuels and oils: $8.6 billion (7%)
5. Pharmaceuticals: $6.8 billion (5.5%)
6. Plastics and plastic products: $4.6 billion (3.8%)
7. Optical, technical, and medical equipment: $3.8 billion (3.1%)
8. Iron or steel products: $3.4 billion (2.8%)
9. Non-knitted or non-crocheted clothing and accessories: $3.1 billion (2.5%)
10. Furniture, bedding, lighting, and prefab buildings: $3 billion (2.4%)
Together, these categories accounted for nearly 60% of Denmark's total import expenditures.
Pharmaceuticals saw the fastest growth among these categories, with an increase of 23.1% from 2023 to 2024.
The most significant decline was observed in mineral fuels and oils, which dropped by -9.9% year-over-year.
More Detailed Import Data
At the more specific 4-digit level, Denmark's biggest import categories included:
1. Imported cars: 6.4% of total imports
2. Medication (in dosage form): 3.8%
3. Processed petroleum oils: 2.5%
4. Crude oil: 2.3%
5. Computers and optical readers: 2.2%
6. Smartphones and other phone devices: 2.1%
7. Ships, including cruise ships and cargo vessels: 2%
8. Blood products: 1.2%
9. Fresh or chilled fish (excluding fillets): 1.1%
10. Electrical energy: 1.1%
Leading Danish Importers
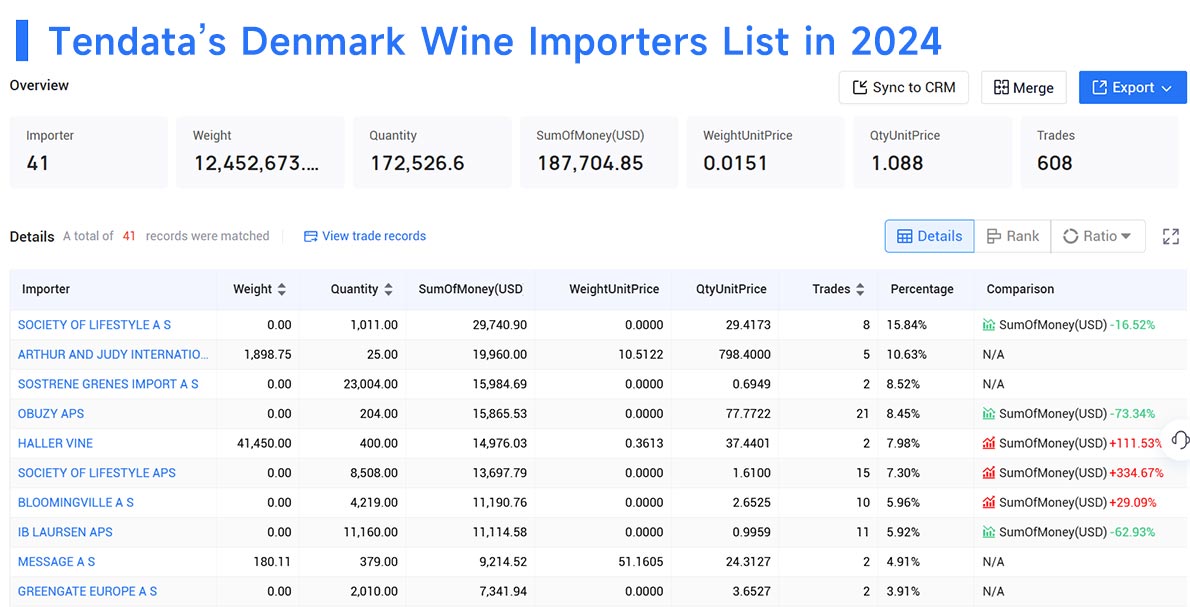
For businesses aiming to enter the Danish market, identifying top importers is crucial. Tendata's platform offers powerful tools to help companies find verified buyers, track purchasing trends, and access contact details.
Here are the top 10 import companies in Denmark in 2024:
1. Society of Lifestyle (15.84%)
2. Arthur and Judy International Co Ltd, Taiwan Branch (10.63%)
3. Søstrene Grene's Import (8.52%)
4. Obuzy Aps (8.45%)
5. Haller Vine (7.98%)
6. Society of Lifestyle Aps (7.3%)
7. Bloomingville (5.96%)
8. IB Laursen Aps (5.92%)
9. Message (4.91%)
10. Greengate Europe (3.91%)

Using this data can help businesses uncover valuable opportunities in Denmark's import market. For further insights into Denmark's import trends or data, reach out to Tendata for a free demo.
Category
Leave Message for Demo Request or Questions


 T-info
 T-discovery

 My
Tendata
 Market Analysis
 Customer
Development
 Competitor
Monitoring
 Customer Relationship


