 Import News
 2025-05-21
Belgium Import Data provides companies with a wide range of information support, from market opportunity identification and competitive analysis to supply chain optimization and customer development, to help them improve decision-making efficiency, reduce operating costs and expand business scope. Through the rational use of Belgium Import Data, enterprises can better grasp the market dynamics, enhance competitiveness and achieve sustainable business growth.
Ⅰ.Functions of Belgium Import Data
1. Detailed Market Analysis
Belgium Import Data comes from official documents such as Belgian import and export declarations, bills of lading and other official documents, and contains core information such as buyers' names, traded products, quantities, amounts, modes of transportation and so on. These data are based on real transactions and can accurately reflect market demand and buyer behavior. Through long-term tracking data, we can grasp the customer's purchasing cycle, product preference, supplier stability and other information.
2. Accurately locate target customers
By inputting product keywords or HS codes through Belgium Import Data, active buyers can be directly screened out, especially high-frequency purchasing enterprises, significantly reducing ineffective search time.

II. Specific Belgium Import Data 2024
(1) From which countries does Belgium mainly import?
Below is a list of Belgium's top 10 import partner countries and their import value:
1. Netherlands(24.04%, $87.43 Billion)
2. Germany(13.59%, $49.44 Billion)
3. France(11.59%, $42.14 Billion)
4. United States(6.01%, $21.87 Billion)
5. Italy(4.64%, $16.86 Billion)
6. China(3.53%, $12.85 Billion)
7. United Kingdom(2.93%, $10.64 Billion)
8. Ireland(2.78%, $10.1 Billion)
9. Switzerland(2.7%, $9.82 Billion)
10. Spain(2.54%, $9.24 Billion)
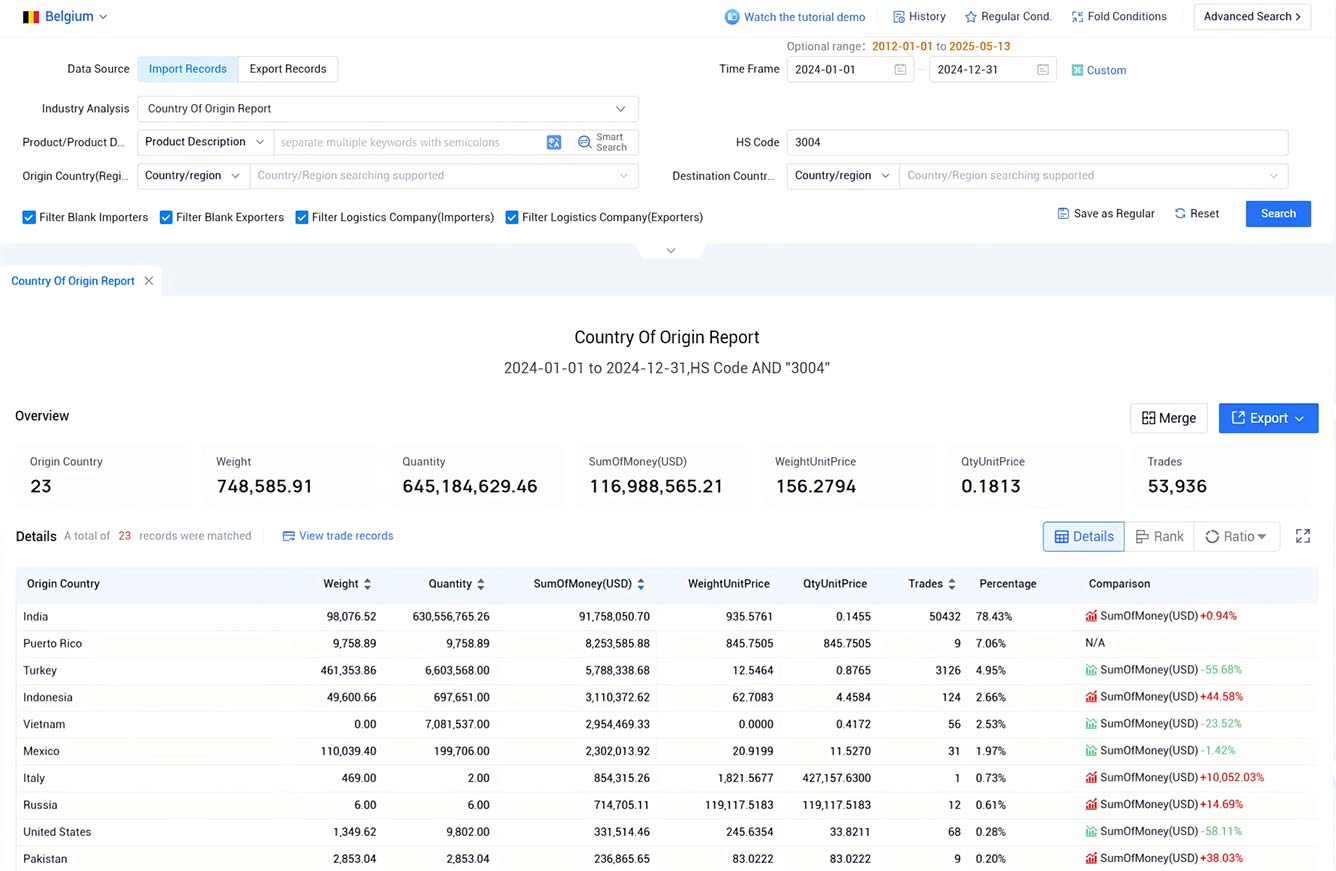
These are important markets for Belgian imports. Want to conduct a trading partner analysis for specific Belgian products? Visit Tendata to easily explore the global market. For example, the HS code 3004 shows you the main trading partner countries to which Belgium imports this product:
1.India(78.43%, $91.76 Million)
2.Puerto Rico(7.06%, $8.25 Million)
3.Turkey(4.95%, $5.79 Million)
4.Indonesia(2.66%, $3.11 Million)
5.Vietnam(2.53%, $2.95 Million)
6.Mexico(1.97%, $2.3 Million)
7.Italy(0.73%, $0.85 Million)
8.Russia(0.61%, $0.71 Million)
9.United States(0.28%, $0.33 Million)
10.Pakistan(0.2%, $0.24 Million)

(2) What are the main imported products in Belgium?
According to the Belgium Import Data provided by Tendata, the following is a list of the main products imported into Belgium:
1. Mineral fuels, oils, distillation products(16.3%, $59.79 Billion)
2. Vehicles other than railway, tramway(12.29%, $45.08 Billion)
3. Pharmaceutical products(12.06%, $44.26 Billion)
4. Machinery, nuclear reactors, boilers(7.81%, $28.65 Billion)
5. Electrical, electronic equipment(5.92%, $21.72 Billion)
6. Organic chemicals(3.87%, $14.19 Billion)
7. Plastics(3.35%, $12.29 Billion)
8. Optical, photo, technical, medical apparatus(2.9%, $10.65 Billion)
9. Pearls, precious stones, metals, coins(2.67%, $9.81 Billion)
10. Iron and steel(2.42%, $8.87 Billion)
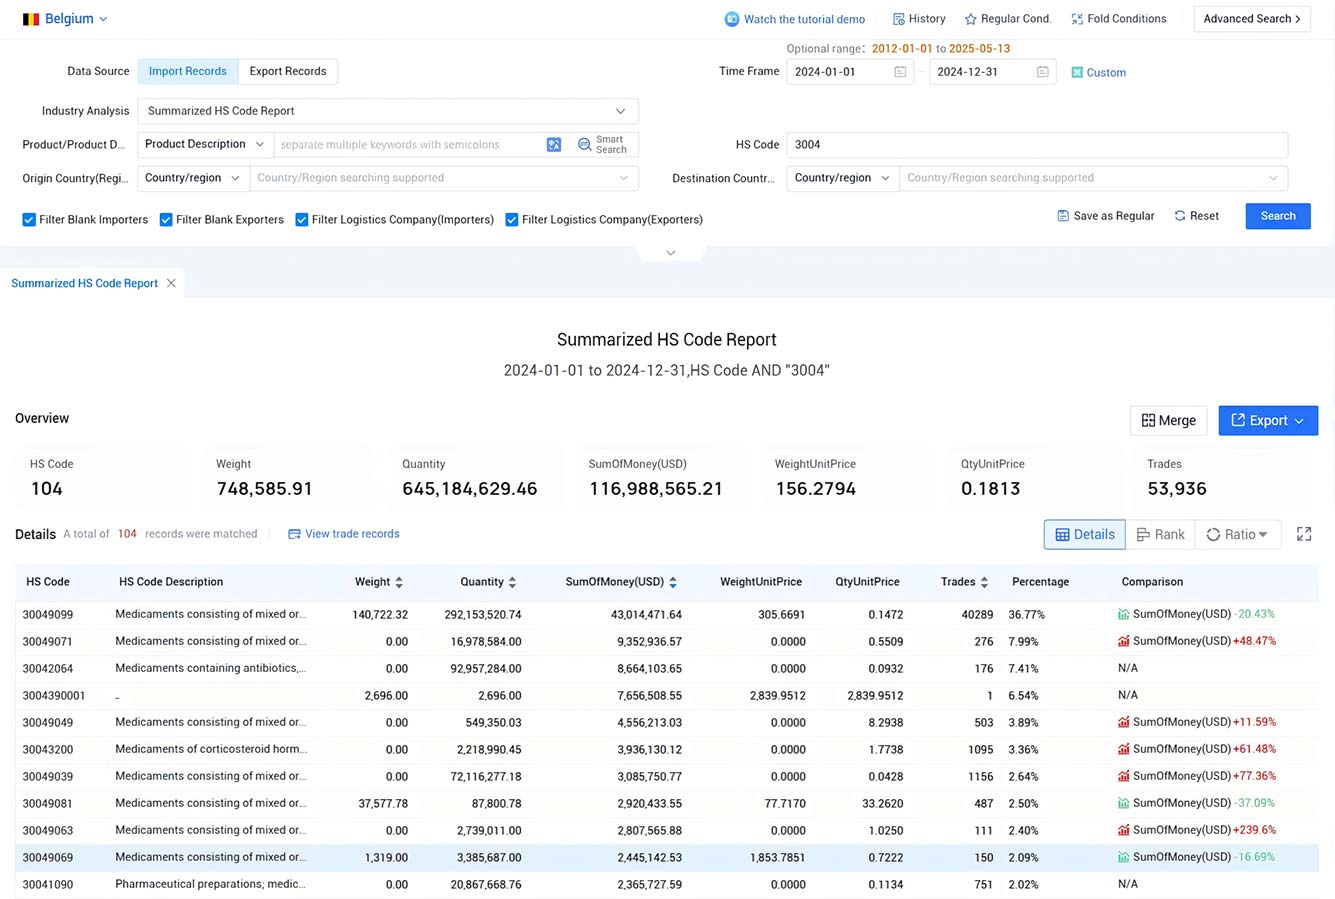
Tendata can help you get a more detailed picture of Belgian imports with Belgium Import Data, Tendata's diverse reports are designed to save you time and are very easy to use. For example, HS code 3004 shows you which product categories are imported into Belgium and the corresponding HS code list:
1.HS Code:30049099(36.77%, $43.01 Million):Medicaments consisting of mixed or unmixed products for therapeutic or prophylactic purposes, put up in measured doses (including those in the form of transdermal administration) or in forms or packings for retail sale (excluding medicaments containing antibiotics)
2.HS Code:30049071(7.99%, $9.35 Million):Medicaments consisting of mixed or unmixed products for therapeutic or prophylactic purposes, put up in measured doses (including those in the form of transdermal administration) or in forms or packings for retail sale (excluding medicaments containing antibiotics)
3.HS Code:30042064(7.41%, $8.66 Million):Medicaments containing antibiotics, put up in measured doses incl. those in the form of transdermal administration or in forms or packings for retail sale (excluding medicaments containing penicillins or derivatives thereof with a penicillanic structure)
4.HS Code:3004390001(6.54%, $7.66 Million)
5.HS Code:30049049(3.89%, $4.56 Million):Medicaments consisting of mixed or unmixed products for therapeutic or prophylactic purposes, put up in measured doses (including those in the form of transdermal administration) or in forms or packings for retail sale (excluding medicaments containing antibiotics)
6.HS Code:30043200(3.36%, $3.94 Million):Medicaments of corticosteroid hormones, their derivatives and structural analogues; in measured doses or in retail packings.
7.HS Code:30049039(2.64%, $3.09 Million):Medicaments consisting of mixed or unmixed products for therapeutic or prophylactic purposes, put up in measured doses (including those in the form of transdermal administration) or in forms or packings for retail sale (excluding medicaments containing antibiotics)
8.HS Code:30049081(2.5%, $2.92 Million):Medicaments consisting of mixed or unmixed products for therapeutic or prophylactic purposes, put up in measured doses (including those in the form of transdermal administration) or in forms or packings for retail sale (excluding medicaments containing antibiotics)
9.HS Code:30049063(2.4%, $2.81 Million):Medicaments consisting of mixed or unmixed products for therapeutic or prophylactic purposes, put up in measured doses (including those in the form of transdermal administration) or in forms or packings for retail sale (excluding medicaments containing antibiotics)
10.HS Code:30049069(2.09%, $2.45 Million):Medicaments consisting of mixed or unmixed products for therapeutic or prophylactic purposes, put up in measured doses (including those in the form of transdermal administration) or in forms or packings for retail sale (excluding medicaments containing antibiotics)

(3) What are the main importers of products from Belgium?
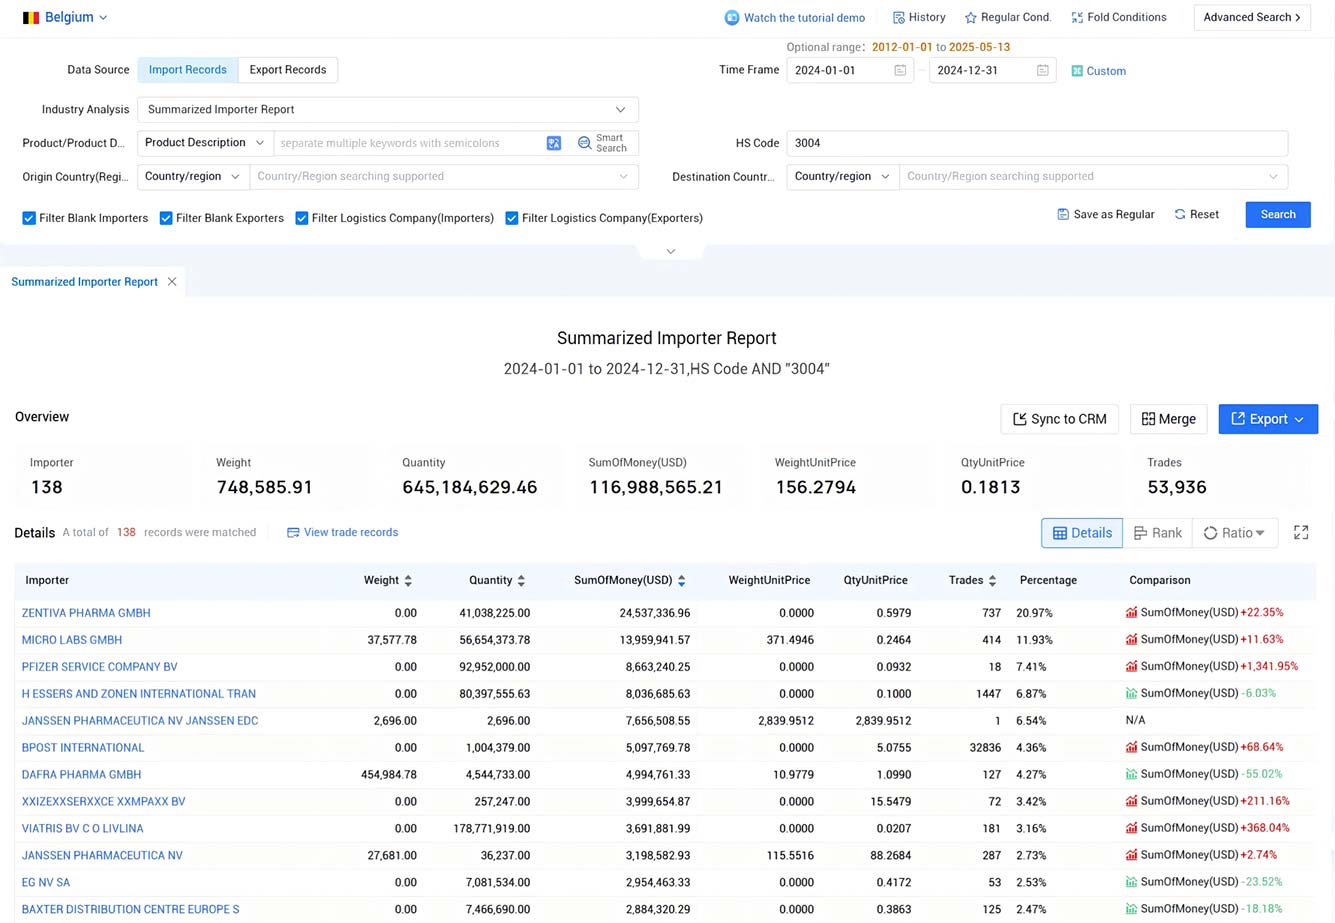
According to the product name or HS code, you can get the list of buyers of your concern products on Tendata. Not only that, you can also get their specific purchasing records, suppliers, purchasing price, purchasing time, purchasing quantity and so on. Below is an example of a list of major importers searched on Tendata with HS code 3004:
1.ZENTIVA PHARMA GMBH(20.97%, $24.54 Million)
2.MICRO LABS GMBH(11.93%, $13.96 Million)
3.PFIZER SERVICE COMPANY BV(7.41%, $8.66 Million)
4.H ESSERS AND ZONEN INTERNATIONAL TRAN(6.87%, $8.04 Million)
5.JANSSEN PHARMACEUTICA NV JANSSEN EDC(6.54%, $7.66 Million)
6.BPOST INTERNATIONAL(4.36%, $5.1 Million)
7.DAFRA PHARMA GMBH(4.27%, $4.99 Million)
8.XXIZEXXSERXXCE XXMPAXX BV(3.42%, $4 Million)
9.VIATRIS BV C O LIVLINA(3.16%, $3.69 Million)
10.JANSSEN PHARMACEUTICA NV(2.73%, $3.2 Million)

What can you expect from Tendata?
What products do buyers import? How much and how often? What countries have they previously imported from? Names of suppliers they have worked with?Tendata is the top data-driven tool for examining shipments from all over the world. With our import/export database, you can easily access the relevant information.
Why choose Tendata's Belgium Import Data?
Tendata connects trade data from 228 countries and territories, business data from 198 countries, and internet data from 172 countries. One click search presents in-depth data on 500 million+ companies around the world with real purchasing history and intent, and Tendata provides access to 850 million+ company executives' contact information, allowing you to quickly connect with a high-quality customer base and save you a lot of time.
If you are a marketer or trader eager to import more cost-effective products, please contact us today for global trade data. Please visit our website at tendata.com or send an email to emarketing@tendata.cn for more information.
Category
Leave Message for Demo Request or Questions


 T-info
 T-discovery

 My
Tendata
 Market Analysis
 Customer
Development
 Competitor
Monitoring
 Customer Relationship


