 Import News
 2025-06-09
In 2024, global gold import expenditures reached approximately US$574.6 billion, reflecting a 42.2% rise since 2020, when international purchases totaled $404.1 billion.
On a year-over-year basis, the global value of gold imports climbed 3.6% from $554.6 billion in 2023.
The top five gold-importing nations—Switzerland, mainland China, the United Kingdom, Hong Kong, and India—together made up over 70% of the total global demand for gold that year.
In terms of regions, Asia led the globe in gold imports in 2024, bringing in gold valued at $332.4 billion, or 57.9% of the worldwide total.
Europe followed, responsible for 36.2% of gold imports. However, the European Union’s share was just 4.3%, mainly because heavyweights like Switzerland and the UK are not part of the EU bloc.
North America accounted for 4.5%, while much smaller shares went to Oceania (1.1%, mainly Australia), Africa (0.2%), and Latin America (0.1%, excluding Mexico but including the Caribbean).
For classification, the Harmonized Tariff System (HTS) code for gold is 7108.

Leading Gold Importing Countries in 2024
Here are the 15 nations that spent the most on imported gold:
1.Switzerland: $105.2B (18.3%)
2.Mainland China: $102.9B (17.9%)
3.United Kingdom: $77.2B (13.4%)
4.Hong Kong: $65.5B (11.4%)
5.India: $51.8B (9%)
6.United Arab Emirates: $24.8B (4.3%)
7.Singapore: $17.6B (3.1%)
8.Türkiye: $17.1B (3%)
9.United States: $15.9B (2.8%)
10.Thailand: $15.4B (2.7%)
11.Italy: $10.3B (1.8%)
12.Canada: $9.6B (1.7%)
13.Saudi Arabia: $8.2B (1.4%)
14.Australia: $6.5B (1.1%)
15.Germany: $6.1B (1.1%)
Combined, these 15 countries were responsible for 92.9% of all gold imports globally.
Biggest Growth and Decline in Imports
Among these nations, the fastest-growing import markets for gold since 2023 were:
·Thailand: +93.8%
·Germany: +71.5%
·United Kingdom: +60.6%
·Italy: +54.7%
Meanwhile, two major markets saw sharp declines:
·UAE: –67.7%
·Türkiye: –43%
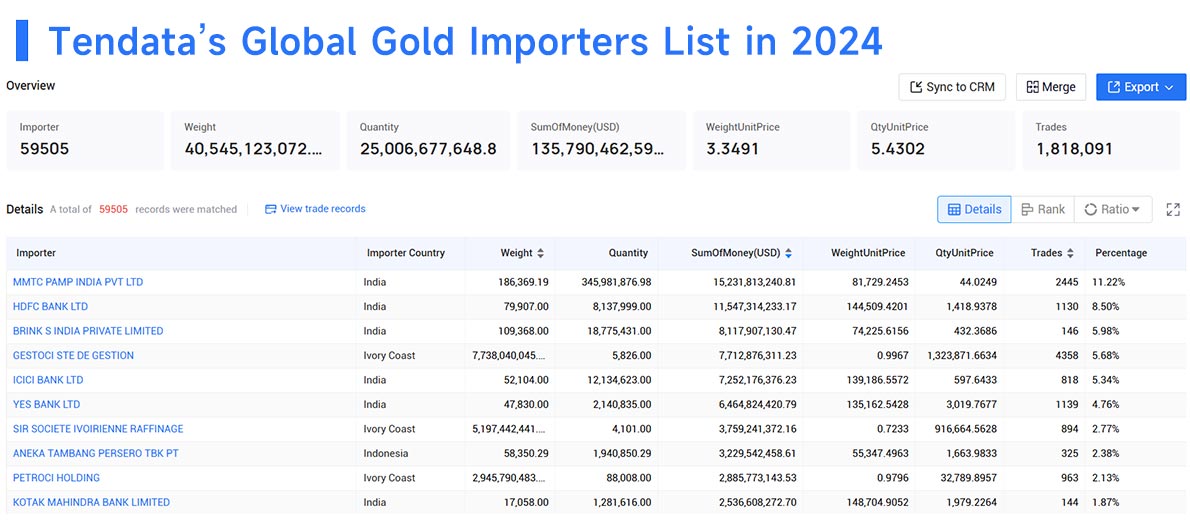
Top Gold Importing Companies (2024)
Based on Tendata's global trade analysis
1.MMTC PAMP India Pvt Ltd – $15.23B (11.22%)
2.HDFC Bank Ltd – $11.55B (8.5'%)
3.Brink's India Pvt Ltd – $8.12B (5.98%)
4.GESTOCI STE DE GESTION – $7.71B (5.68%)
5.ICICI Bank Ltd – $7.25B (5.34%)
6.YES Bank Ltd – $6.46B (4.76%)
7.SIR Société Ivoirienne de Raffinage – $3.76B (2.77%)
8.Aneka Tambang Persero Tbk PT – $3.23B (2.38%)
9.PETROCI Holding – $2.89B (2.13%)
10.Kotak Mahindra Bank Ltd – $2.54B (1.87%)

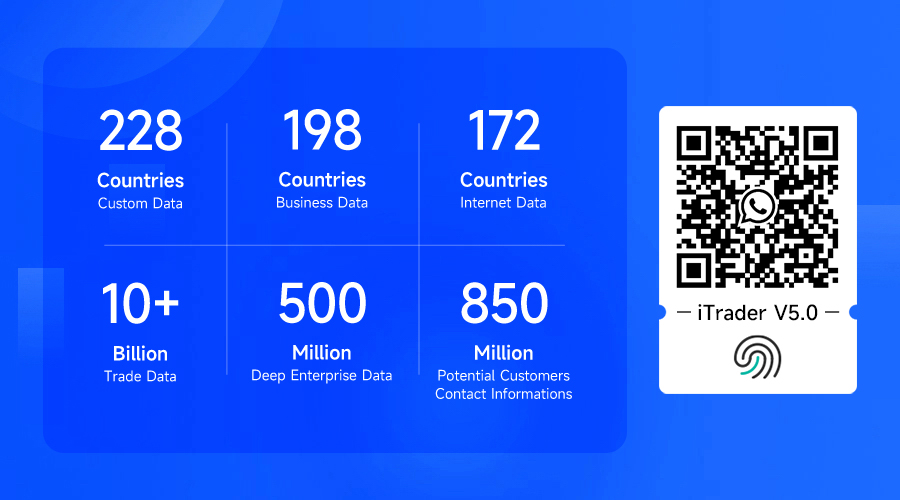
Trade Data: Tendata has accumulated 10 billion+ trade transaction details
from 228+ countries and regions, supporting one-click query of major import and
export countries, customer distribution, product volume and price, etc., which
helps import and export enterprises to accurately understand the global market
and the trade environment of the target market.
Business Data: Tendata has a total of 500 million+ in-depth enterprise data, involving 198 countries and 230+ industry segments, covering the current operation status, financial information, product information, business relationships, intellectual property rights, etc. The data is fine, which makes it easy to assess the real strength of the target customers in depth, and expand the potential customer base.
Internet Data: Tendata's total of 850 million+ contact data, integrating social media, emails and other multi-channel contacts, helps to reach key contacts of enterprises with one click and improve the efficiency of customer development, as well as news and public opinion monitoring, which helps to grasp the Internet information in a timely manner.

Category
Leave Message for Demo Request or Questions


 T-info
 T-discovery

 My
Tendata
 Market Analysis
 Customer
Development
 Competitor
Monitoring
 Customer Relationship


