 Import News
 2025-06-16
In 2024, global iron ore imports amounted to approximately US$181 billion.
This marks a 2.5% decline from the $185.7 billion recorded in 2023, signaling a slight downturn in international demand.
The top five iron ore importing nations were mainland China, Japan, South Korea, Germany, and Taiwan. Together, these countries were responsible for a massive 88% share of total global iron ore imports.
Regional Import Trends
From a regional standpoint, Asian economies accounted for the lion’s share of global iron ore purchases, importing around $165.1 billion, or 91.2% of total imports.
Trailing behind Asia were:
·Europe: 6.1%
·Africa: 1.04%
·North America: 1.02%
·Latin America and the Caribbean (excluding Mexico): 0.6%
·Oceania (Australia and New Zealand): 0.05%
The Harmonized Tariff System code for iron ore and concentrates, including roasted iron pyrites, is 2601.
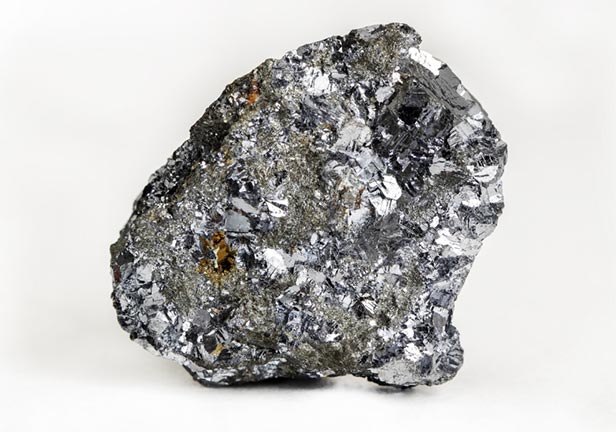
Leading Iron Ore Importers in 2024
Below are the 15 countries that recorded the highest dollar value in iron ore imports:
1.Mainland China: $133.2 billion (73.6%)
2.Japan: $11.3 billion (6.2%)
3.South Korea: $8.3 billion (4.6%)
4.Germany: $4.2 billion (2.3%)
5.Taiwan: $2.3 billion (1.3%)
6.Malaysia: $1.6 billion (0.9%)
7.Indonesia: $1.52 billion (0.8%)
8.Vietnam: $1.47 billion (0.8%)
9.Bahrain: $1.23 billion (0.7%)
10.Türkiye: $1.21 billion (0.7%)
11.France: $1.15 billion (0.6%)
12.Netherlands: $1.0 billion (0.6%)
13.Oman: $954.1 million (0.5%)
14.Egypt: $845.3 million (0.5%)
15.United States: $834.2 million (0.5%)
Combined, these 15 countries were responsible for 94.5% of the total iron ore imported worldwide in 2024.
Noteworthy Market Shifts
The most dynamic markets showing growth from 2023 to 2024 included:
·Indonesia: +14.3%
·Netherlands: +9.8%
·Türkiye: +8.7%
·Malaysia: +8.6%
Meanwhile, some markets contracted sharply, including:
·Egypt: -48.1%
·Oman: -32%
·Bahrain: -23.5%
·Vietnam: -21.2%
Key Iron Ore Importing Companies
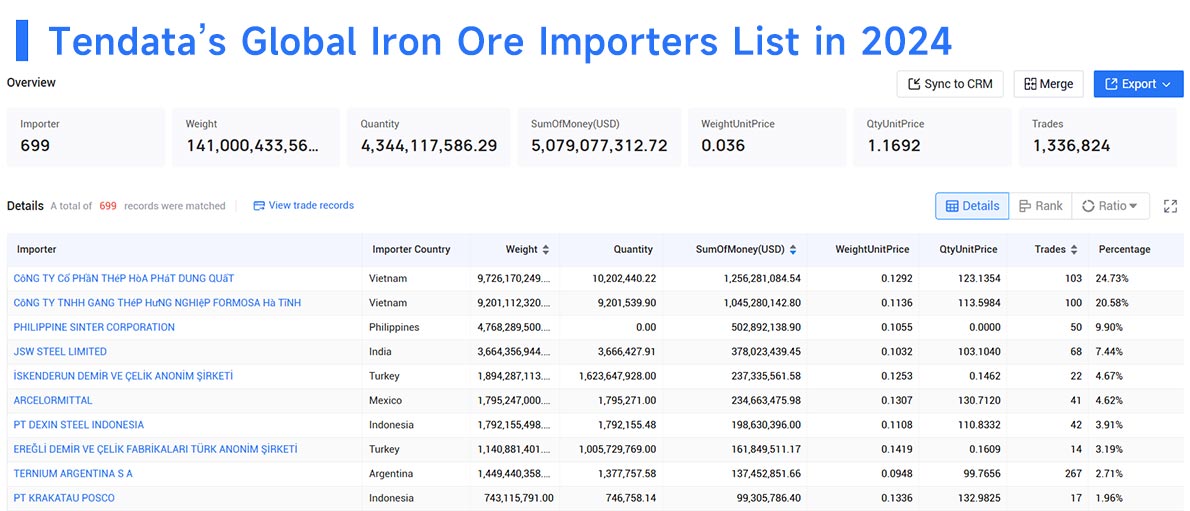
Based on data from Tendata, the top corporate importers of iron ore globally include:
1.Công Ty Cổ Phần Thép Hòa Phát Dung Quất – 24.73% ($1.26 billion)
2.Công Ty TNHH Gang Thép Hưng Nghiệp Formosa Hà Tĩnh – 20.58% ($1.05 billion)
3.Philippine Sinter Corporation – 9.9% ($502.89 million)
4.JSW Steel Limited – 7.44% ($378.02 million)
5.İskenderun Demir ve Çelik A.Ş. – 4.67% ($237.34 million)
6.ArcelorMittal – 4.62% ($234.66 million)
7.PT Dexin Steel Indonesia – 3.91% ($198.63 million)
8.Ereğli Demir ve Çelik Fabrikaları T.A.Ş. – 3.19% ($161.85 million)
9.Ternium Argentina S.A. – 2.71% ($137.45 million)
10.PT Krakatau Posco – 1.96% ($99.31 million)
These corporations are among the primary drivers of global iron ore demand, contributing significantly to trade volumes.
Taking PVC pipe as an example, through Tendata, we screened the list of active buyers with purchasing records in the past year.
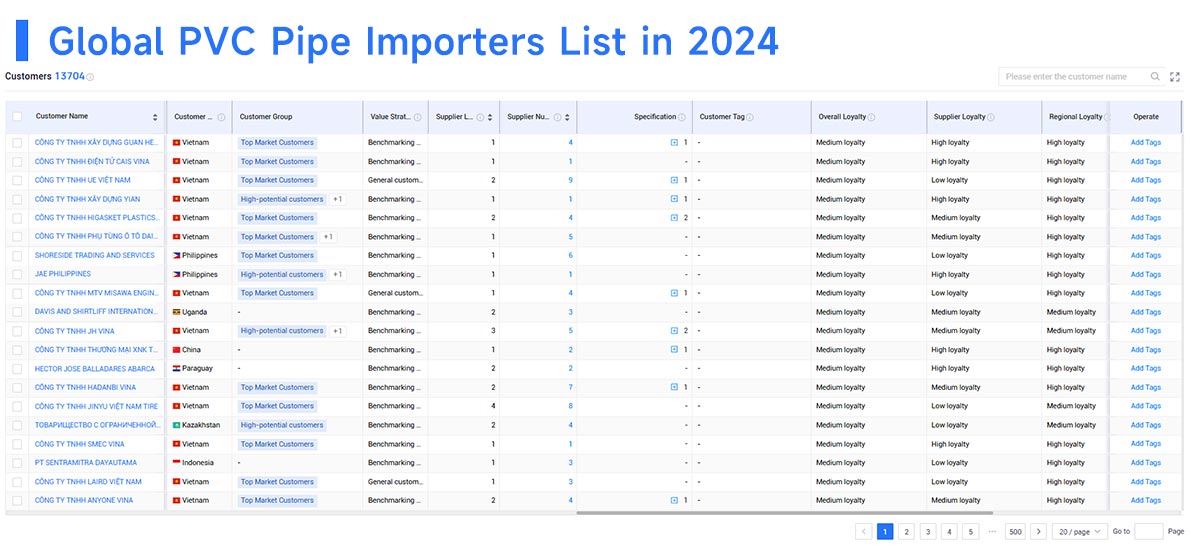
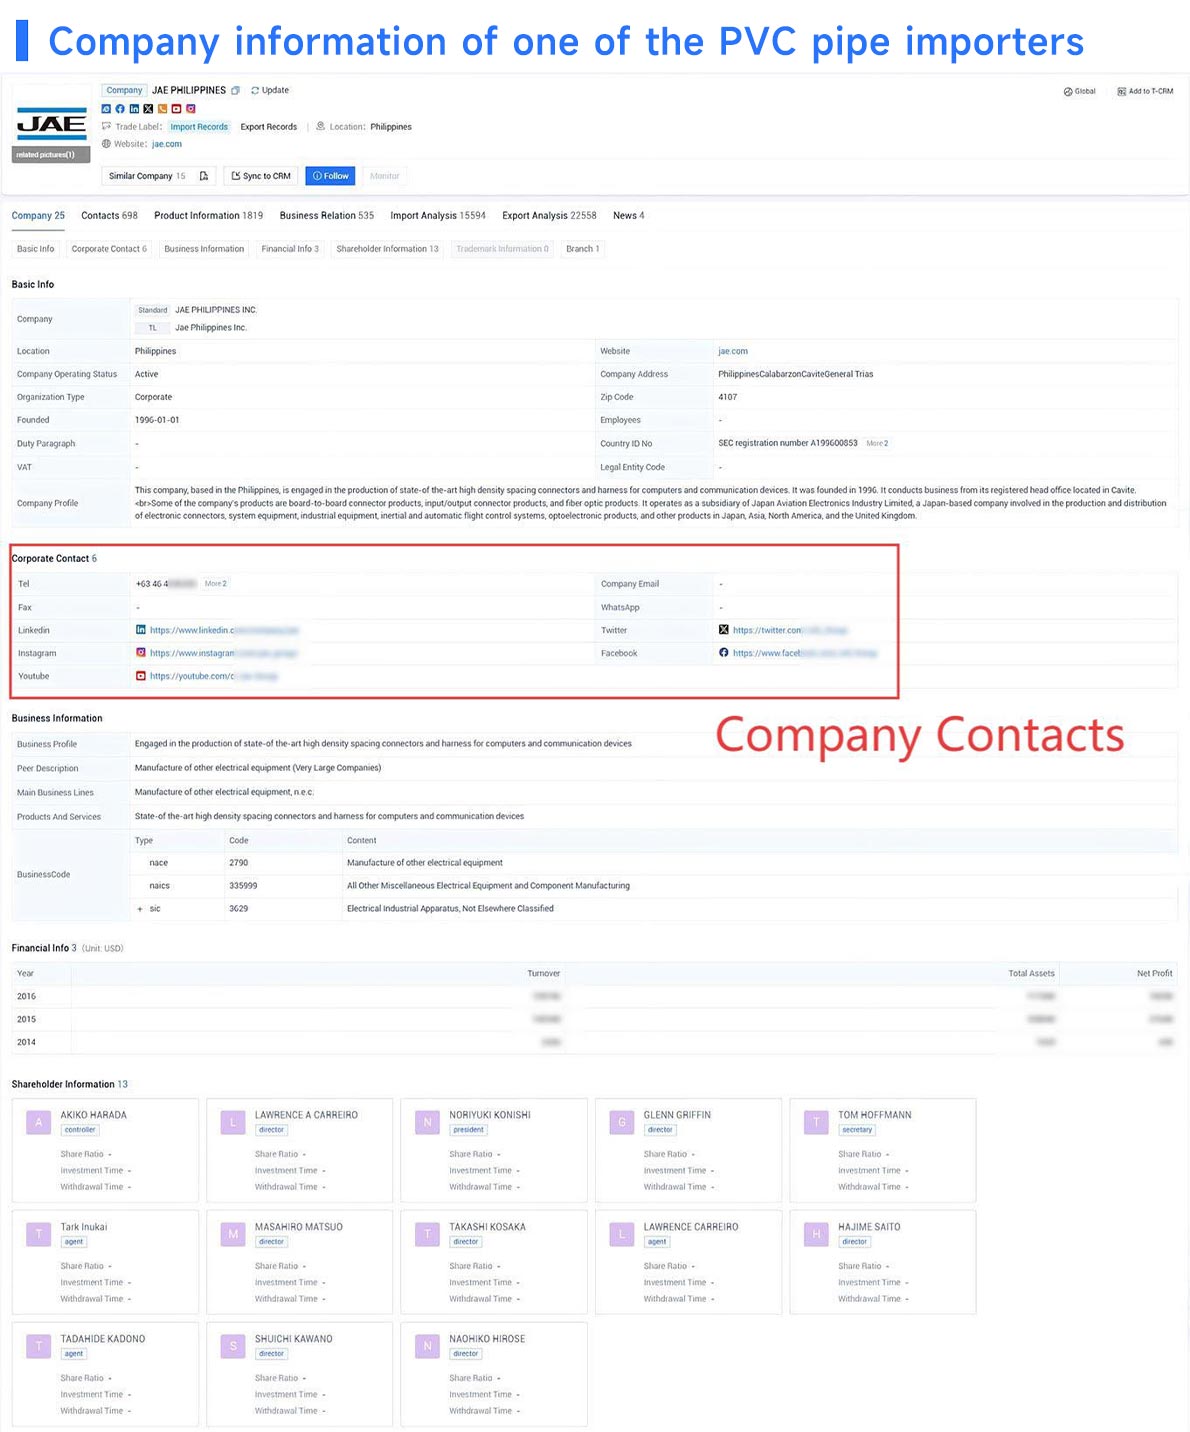
Image source: Tendata
For the target customers, in-depth understanding of their company's import trade records, HS codes, suppliers, supply chain, import regions, etc., to assist in analyzing the purchasing power and sustainability of buyers, to determine the development value of the customer; with these trade records, we can look for the right time to enter and point of entry, and more smoothly with the customer ice-breaking communication, to lay the foundation for the final cooperation.
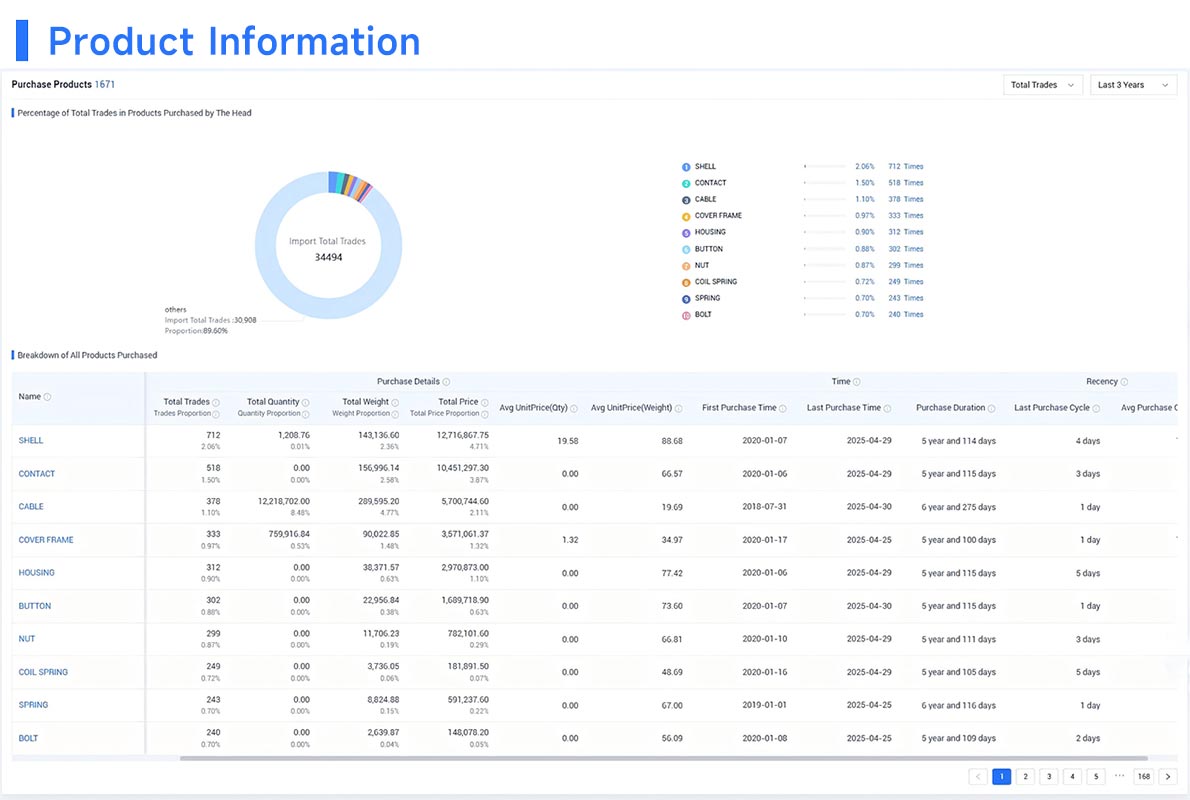
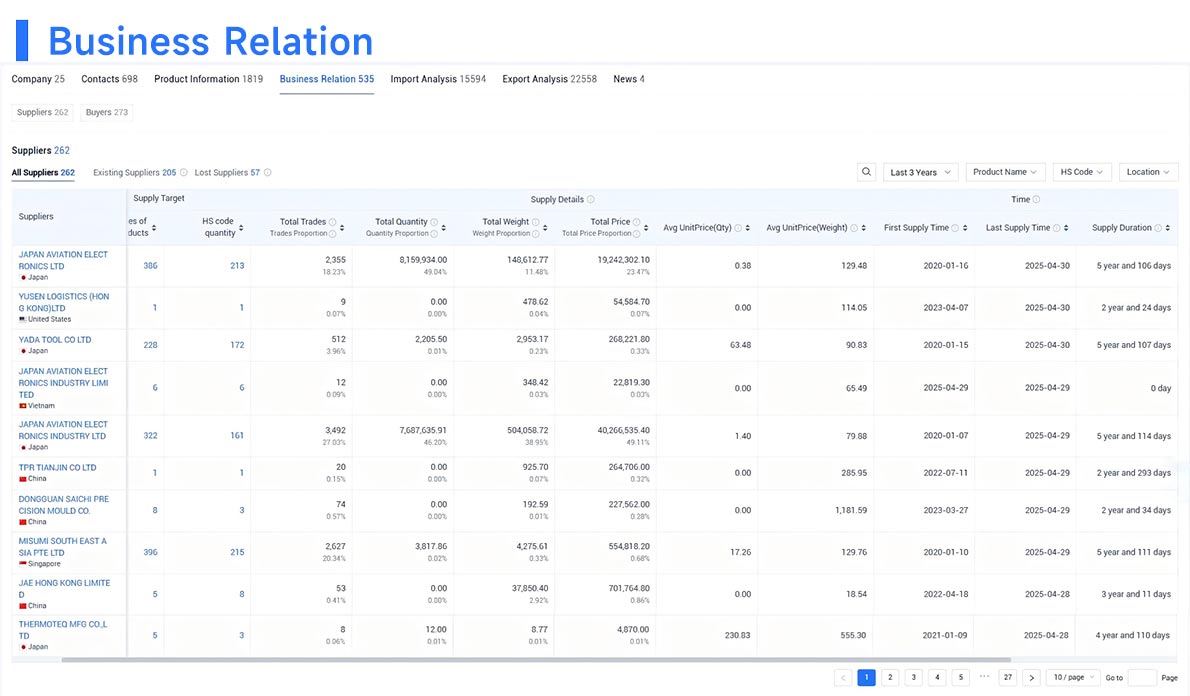
Image source: Tendata
Tendata also provides customer contact information. By clicking on the "Contacts" section, you can view the details of key decision makers such as purchasers and executives, including their email addresses and social accounts such as LinkedIn and Facebook. This approach helps us to quickly reach out to our customers and increase our customer development efficiency.
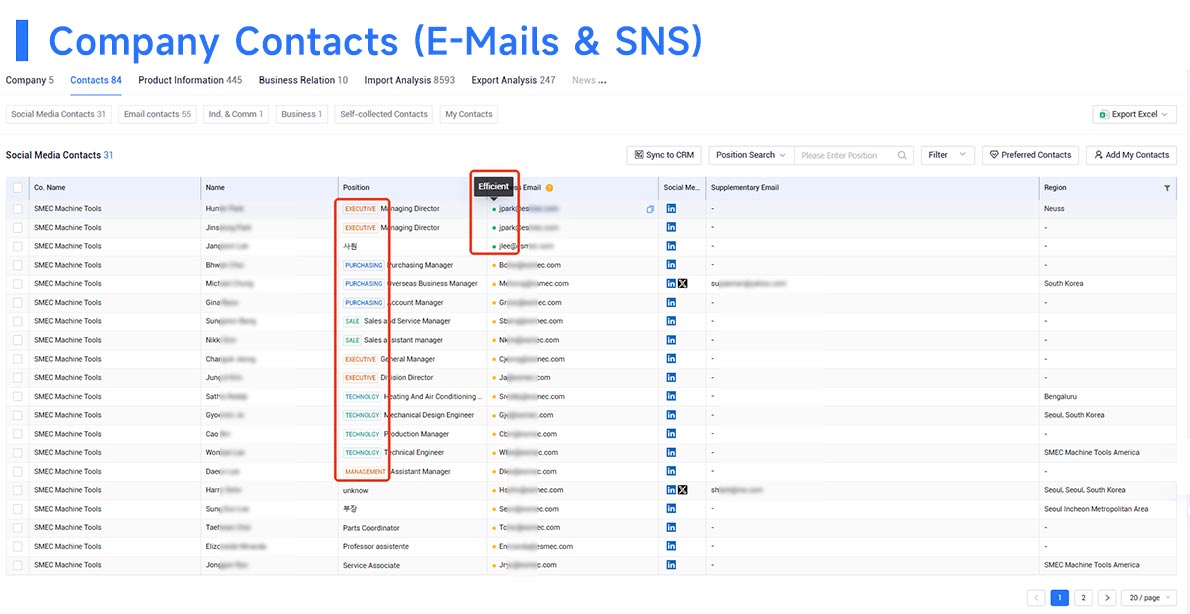
Image source: Tendata
Category
Leave Message for Demo Request or Questions


 T-info
 T-discovery

 My
Tendata
 Market Analysis
 Customer
Development
 Competitor
Monitoring
 Customer Relationship


