 Market Insights
 2023-12-01

Let's find out the top 10 most imported products of Candy in 2023 by HS code based on Candy's import data.
When you want to start a candy import business, consider starting with the following products:
1.17049099(28.59%, $158.43 Million):Sugar confectionery (including white chocolate), not containing cocoa
2.1806901900(20.12%, $240.68 Million):Chocolate and chocolate products in the form of chocolates, whether or not filled, not containing alcohol
3.1806905009(10.43%, $53.26 Million):Chocolate and other food preparations containing cocoa
4.170199100011(5.33%, $2590.16 Million):Cane or beet sugar and chemically pure sucrose, in solid form (excluding cane and beet sugar containing added flavouring or colouring and raw sugar): Sugar cubes
5.74040012(3.77%, $65.45 Million):Waste and scrap, of copper (excluding ingots or other similar unwrought shapes, of remelted copper waste and scrap, ashes and residues containing copper, and waste and scrap of primary cells, primary batteries and electric accumulators): Copper scrap cove
6.1806905002(2.78%, $10.8 Million):Sugar confectionery and substitutes therefor made from sugar substitution products, containing cocoa
7.1704906500(1.66%, $801.85 Million):Gum and jelly confectionery, incl. fruit pastes in the form of sugar confectionery
8.170390000000(0.99%, $2022.25 Million):Beet molasses resulting from the extraction or refining of sugar
9.170490(0.96%, $107.59 Million):Sugar confectionery not containing cocoa, incl. white chocolate (excl. chewing gum)
10.20079990000(0.82%, $0 Million):Jams, jellies, marmalades, purées or pastes of fruit, obtained by cooking, whether or not containing added sugar or other sweetening matter (excluding citrus fruit and homogenised preparations of subheading 2007.10): Jams jellies mrmlds etc of other fruit

According to the latest import data from Tendata, candy importers tend to import candy from the following countries:
1.Russia(30.78%, $11054.84 Million)
2.Switzerland(27.3%, $9802.88 Million)
3.China(6.44%, $2313.1 Million)
4.Germany(6.11%, $2195.62 Million)
5.Brazil(2.71%, $971.56 Million)
6.Saudi Arabia(1.75%, $627 Million)
7.United States(1.7%, $609.61 Million)
8.India(1.61%, $578.25 Million)
9.Italy(1.55%, $555.99 Million)
10.Turkey(1.42%, $508.64 Million)

Let's find out what types of candies are available for import from these countries:
1. Russia: Russia may offer various traditional candies, including Sherlock candies and coconut candies.
2. Switzerland: Renowned for high-quality chocolates, Switzerland may also provide traditional candies such as gummies and milk candies.
3. China: China may offer a variety of traditional candies along with modern innovations, including frozen treats and diverse flavored chocolates.
4. Germany: Germany is known for its hard candies, gummies, and chocolates, including Haribo's gummy candies and Mozartkugel chocolates.
5. Brazil: Brazil may provide unique chocolates and traditional candies, such as Brazil's nut candies.
6. Saudi Arabia: Saudi Arabia may offer traditional Middle Eastern candies like Halwa coffee candies and Wool candies.
7. United States: The U.S. is a global candy hub, providing a wide range of chocolates, gummies, hard candies, and candy bars.
8. India: India may offer various traditional candies like mango candies, Indian bean candies, and creamy fudges.
9. Italy: Italy is known for its diverse chocolates, traditional candies (confetti), and fruity candies.
10. Turkey: Turkey may provide traditional Turkish delights such as Ottoman candies, grape candies, and nut candies.
These are just some examples, and each country has its unique candy traditions and innovative products. Importers can make choices based on the tastes and demands of their target markets.
When you are a candy exporter and want to deal with the best candy importers in the world, get to know about the candy importers in the world.
Here are the top 10 global candy importers in 2023:
1.CôNG TY TNHH THựC PHẩM âN NAM(27.13%, $9742.83 Million)
2.ООО "CANDY WORLD"(15.23%, $5469.35 Million)
3.ООО "BIOLI PRODUKTION"(4.9%, $1761.36 Million)
4.ООО "CHOCO MELT SERVICE"(3.56%, $1278.18 Million)
5.SHTORK, OOO(2.04%, $733.88 Million)
6.ООО "FURAC ENTERPRICE"(1.46%, $525.65 Million)
7.STORCK CENTRAL ASIA LLP(1.06%, $381.05 Million)
8.ООО"CANDY MIX GOLD"Узбекистан(0.98%, $350.64 Million)
9.CôNG TY TNHH PERFETTI VAN MELLE (VIệT NAM)(0.89%, $320.9 Million)
10.OOO STORCK(0.78%, $280.84 Million)
If you would like more data, please contact Tendata.

The Role of Customs Data
>>>Click to Get FREE ACCESS TO CUSTOMS DATA from 80+ Countries<<<
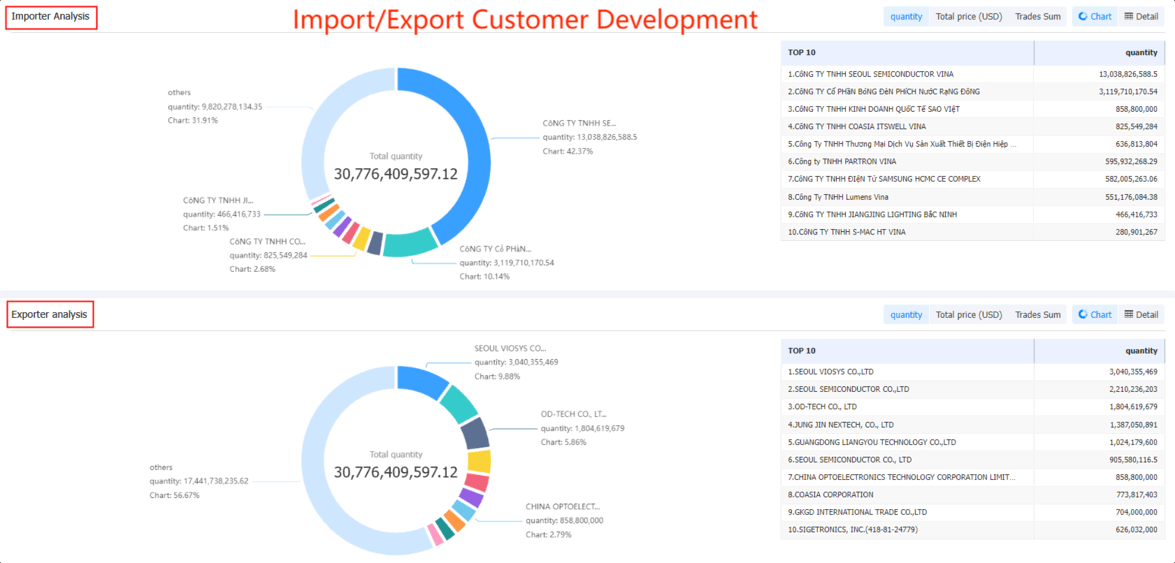
In global trade, it is crucial to recognize the significance of customs data. When customs data is effectively aligned with business development, it greatly enhances the volume of global trade operations. Below, Tendata will elucidate three key applications of import and export data:
1. Market Analysis
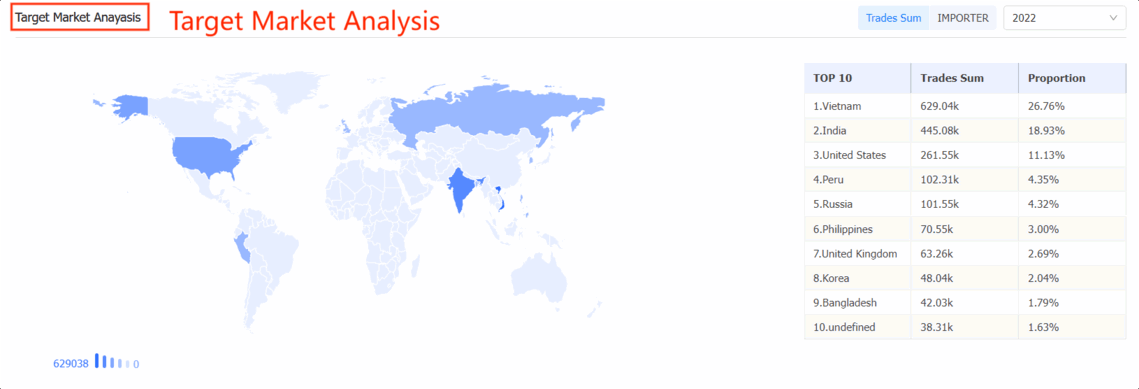
Analyzing market trends and frontiers involves assessing market demands across different regions and juxtaposing product prices. This facilitates the selection of target markets with high profitability and substantial demand. Simultaneously, by querying customs data, one can gain insights into product market distribution and changing trends, enabling timely adjustments to marketing strategies.
Tendata iTrader provides access to customs data from over 80 countries (>>>Click to GET FREE ACCESS TO CUSTOMS DATA from 80+ Countries<<<), along with business data from 198 countries and over 10 billion trade records. Through multidimensional aggregation and analysis of global market information such as buyers, suppliers, countries of origin, trading cycles, and trade ports, Tendata deeply dissects target markets. This enables the formulation of guiding marketing strategies, product strategies, and competitive strategies. It optimizes production and logistics systems, achieving precision targeting. (>>>Click to GET SAMPLE DATA ONLINE<<<)

2. Customer Development
Customer development is a widely used function that involves finding potential high-quality customers through product keywords, HS codes, or filtering based on transaction frequency, scale, traded products, and trade partners. Coupled with contact information, this approach facilitates direct engagement with buyers.
Tendata combines trade data from 208 countries, business data from 198 countries and regions, and internet data from 141 countries to create a comprehensive database. With instantaneous search results, global target customers are presented in 0.01 seconds (>>>Click to Apply for Free Trial Data<<<).

3. Customer Acquisition
Customer acquisition involves examining changes in customers' trade partners to understand whether they are engaging new suppliers and if there is a need to optimize current approaches. This can also be used to analyze peer-to-peer transactions and understand peer pricing. At times, data can reflect the customer situations of peers, aiding in customer acquisition.
Tendata's in-depth customer information assists in analyzing detailed buyer profiles and provides contact details for numerous high-level executives. This represents invaluable sales material (>>>Click to Apply for Free Trial Data<<<).
Today, Tendata from Shanghai shares the extended value brought by customs data. They eagerly anticipate gradually highlighting the value of utilizing these combinations of customs data in the subsequent data functionality services of global trade Link (>>>Click to Learn More<<<).
Category
Leave Message for Demo Request or Questions


 T-info
 T-discovery

 My
Tendata
 Market Analysis
 Customer
Development
 Competitor
Monitoring
 Customer Relationship


