 Market Insights
 2024-06-19
In 2022, global sales from exports of drugs and medicines reached a total of US$458.4 billion.
The value of these exported pharmaceuticals has increased by an average of 22.9% since 2018 when the total was $373 billion. From 2021 to 2022 alone, there was a 6.5% increase, up from $450.5 billion.
The top five exporters of drugs and medicines are Germany, Switzerland, Belgium, the United States, and Italy. Together, these five countries accounted for nearly half (49.9%) of the global exports in this sector in 2022.
In 2022, Europe was the leading exporter of drugs and medicines, with sales amounting to $358.2 billion, representing 79.9% of the global total. Asia followed with 9.9%, and North America contributed 8.9%. Smaller shares came from Latin America (0.7%, excluding Mexico but including the Caribbean), Oceania (0.31%, mainly Australia and New Zealand), and Africa (0.26%).
For research, the Harmonized Tariff System (HTS) codes for drugs and medicines are:
- 3003 for medicaments consisting of two or more mixed constituents (2.1% of the global total).
- 3004 for medicaments consisting of unmixed or other mixed products (97.9%).

Leading Countries in Drug and Medicine Exports
The 15 countries with the highest export values in 2022 were:
1. Germany: US$74.5 billion (16.2% of global exports)
2. Switzerland: $47.3 billion (10.3%)
3. Belgium: $36.4 billion (7.9%)
4. United States: $36 billion (7.8%)
5. Italy: $34.8 billion (7.6%)
6. France: $26.1 billion (5.7%)
7. Ireland: $24.5 billion (5.3%)
8. United Kingdom: $21 billion (4.6%)
9. India: $17.8 billion (3.9%)
10. Denmark: $16.1 billion (3.5%)
11. Netherlands: $15.9 billion (3.5%)
12. Slovenia: $14 billion (3%)
13. Spain: $11.6 billion (2.5%)
14. Canada: $9.7 billion (2.1%)
15. Sweden: $7.8 billion (1.7%)
These countries collectively accounted for 85.8% of the global drugs and medicines exports in 2022. Notably, Slovenia, Italy, the United States, and Germany were the fastest-growing exporters.
Conversely, the Netherlands, Switzerland, France, and Sweden saw declines in their export values compared to 2021.
Countries with the Largest Trade Surpluses in Drugs and Medicines
The following countries had the highest net export surpluses in 2022:
1. Germany: US$40.1 billion (up 32.9% from 2021)
2. Ireland: $20.3 billion (up 16%)
3. India: $16.6 billion (up 5.6%)
4. Switzerland: $15.2 billion (down -33.8%)
5. Italy: $13.7 billion (up 67.5%)
6. Denmark: $12 billion (up 5.3%)
7. France: $9.1 billion (down -2%)
8. Belgium: $6.7 billion (down -15.5%)
9. Slovenia: $6.2 billion (up 113.8%)
10. Sweden: $4.6 billion (down -4.8%)
11. Singapore: $4 billion (down -14.2%)
12. Netherlands: $2.6 billion (down -54.9%)
13. Austria: $1.8 billion (down -20.3%)
14. Israel: $1.4 billion (reversing a -$38.7 million deficit)
15. Hungary: $1.1 billion (up 13.4%)
Germany and Ireland were the top countries with the highest trade surpluses, highlighting their strong competitive edge in the global pharmaceuticals market.
Countries with the Largest Trade Deficits in Drugs and Medicines
The following countries experienced the highest net import deficits in 2022:
1. United States: -US$57.6 billion (deficit up 5.9% from 2021)
2. Mainland China: -$16 billion (down -9.2%)
3. Japan: -$13.4 billion (down -3.8%)
4. Russia: -$9.2 billion (up 5.1%)
5. Australia: -$5.8 billion (up 33.5%)
6. South Korea: -$4.7 billion (up 19.3%)
7. Taiwan: -$3.9 billion (up 35.3%)
8. Brazil: -$3.4 billion (up 5.4%)
9. Poland: -$3.3 billion (up 13.7%)
10. Vietnam: -$3.12 billion (up 47%)
11. Saudi Arabia: -$35 billion (down -24.7%)
12. Egypt: -$2.8 billion (up 10.8%)
13. Spain: -$2.7 billion (up 202%)
14. Romania: -$2.6 billion (up 8.5%)
15. Mexico: -$2.2 billion (down -0.3%)
The United States had the largest deficit, indicating a strong demand for imported pharmaceuticals and highlighting opportunities for exporting countries.
Leading Pharmaceutical Export Companies
Here are some of the major companies driving global pharmaceutical exports, along with their home countries:
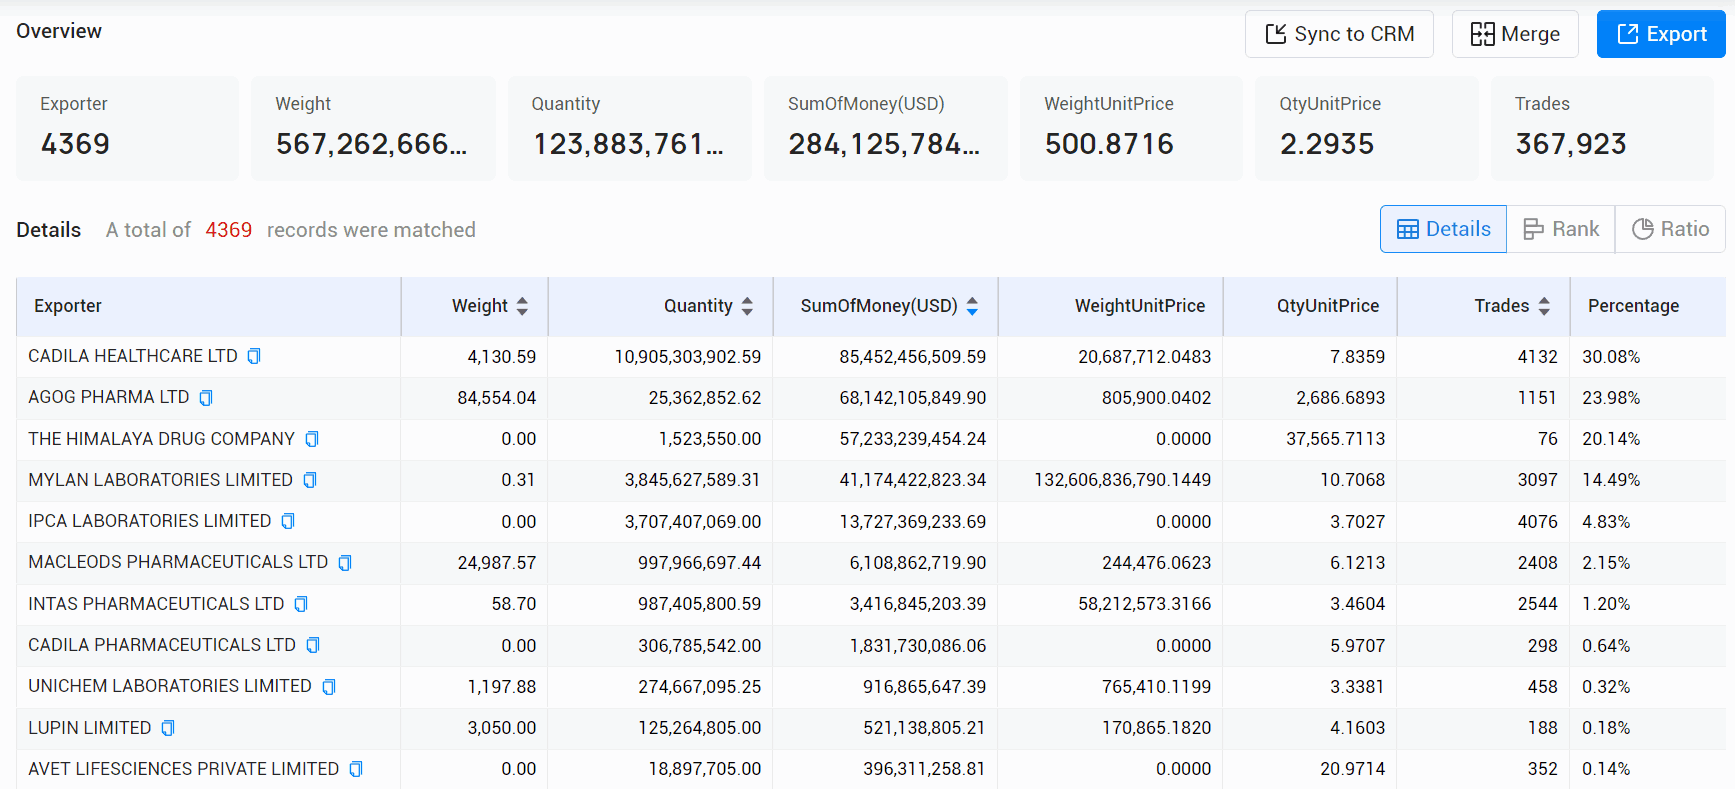
1. Cadila Healthcare Ltd (India): 30.08%, $85,452.46 million
2. Agog Pharma Ltd (India): 23.98%, $68,142.11 million
3. The Himalaya Drug Company (India): 20.14%, $57,233.24 million
4. Mylan Laboratories Limited (India): 14.49%, $41,174.42 million
5. Ipca Laboratories Limited (India): 4.83%, $13,727.37 million
6. Macleods Pharmaceuticals Ltd (India): 2.15%, $6,108.86 million
7. Intas Pharmaceuticals Ltd (India): 1.2%, $3,416.85 million
8. Cadila Pharmaceuticals Ltd (India): 0.64%, $1,831.73 million
9. Unichem Laboratories Limited (India): 0.32%, $916.87 million
10. Lupin Limited (India): 0.18%, $521.14 million
These companies are prominent players in the international pharmaceutical market, contributing significantly to global drug and medicine supplies.

Global Market Analysis
Analysis of the Overall Trade Situation and Trends in the Industry
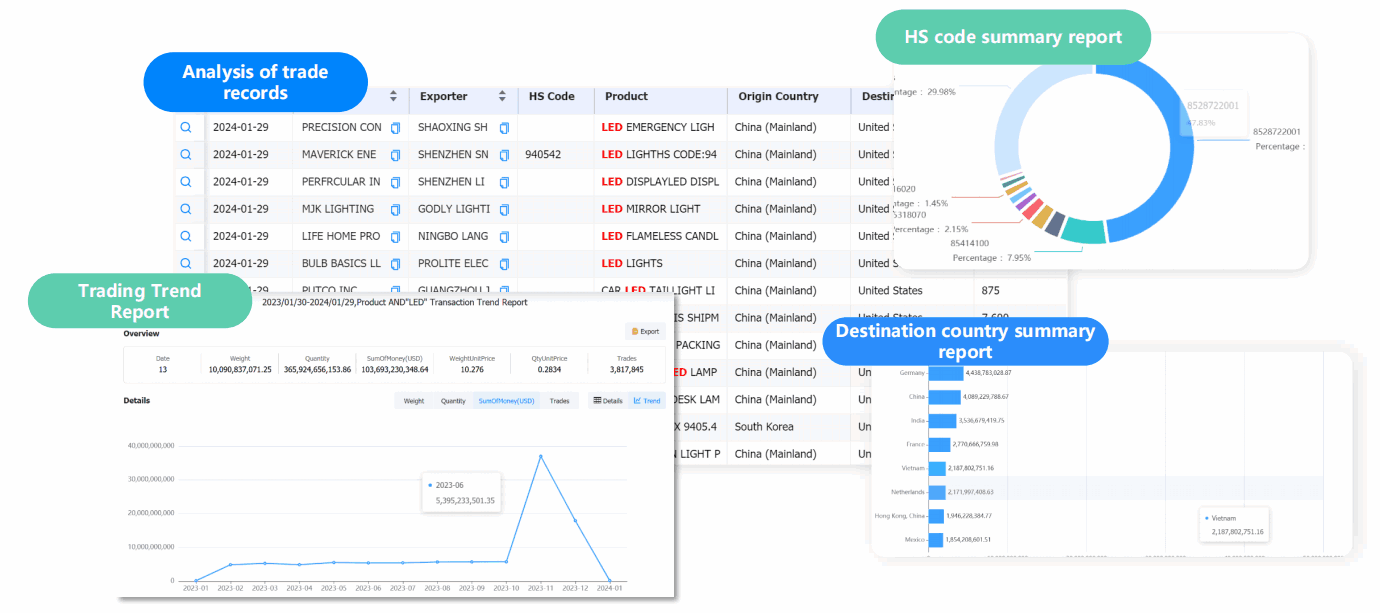
Through its powerful digital platform and in-depth reporting services, Tendata helps users to analyse the overall situation and future trends of the industry, so as to achieve more accurate market positioning and strategic planning.

Analysis of Specific Product Trade Trends in the Target Market
Tendata can provide comprehensive data support and analytical reports for analysing trade trends for a product in a single market, helping you to understand how that product is being traded in that market and identify business opportunities.

Category
Leave Message for Demo Request or Questions


 T-info
 T-discovery

 My
Tendata
 Market Analysis
 Customer
Development
 Competitor
Monitoring
 Customer Relationship


