 Market Insights
 2024-06-19
In 2023, global sales from ice cream exports by country reached a staggering US$9.24 billion, showcasing a remarkable increase of 52.16% since 2018 when the total stood at $4.42 billion. Despite this impressive growth, year over year, the value of globally exported ice cream remained steady, with a modest 43.39% gain compared to 2022's figures.
Europe emerges as a dominant force in the ice cream export market, with Germany, France, Belgium, Netherlands, and Italy leading the pack. Together, these European nations accounted for nearly half (47.1%) of the total value of exported ice cream in 2022.

Top Exporting Countries
Here are the top 15 countries by ice cream exports in 2022:
1. Germany: US$653.6 million (12.5%)
2. France: $570 million (10.9%)
3. Belgium: $450.1 million (8.6%)
4. Netherlands: $414 million (7.9%)
5. Italy: $376.1 million (7.2%)
6. Poland: $305.2 million (5.8%)
7. United States: $267.2 million (5.1%)
8. Spain: $262.1 million (5%)
9. United Kingdom: $158.9 million (3%)
10. Hungary: $154.5 million (3%)
11. Thailand: $137.4 million (2.6%)
12. Slovenia: $92.5 million (1.8%)
13. South Korea: $77.6 million (1.5%)
14. Türkiye: $75.7 million (1.4%)
15. Sweden: $69.3 million (1.3%)
These top exporters collectively accounted for over three-quarters (77.7%) of globally exported ice cream in 2022.
While Spain, Türkiye, Thailand, and South Korea witnessed significant growth in ice cream exports since 2021, others experienced declines, including Slovenia, Belgium, France, United Kingdom, and Poland.
Italy consistently enjoys the highest surplus in ice cream exports, underscoring its strong competitive advantage in this sector. On the other hand, the United Kingdom faces the most substantial deficit, signaling opportunities for ice cream-supplying countries to meet consumer demand.
Ice Cream Exporting Companies
Major players in the ice cream industry include:
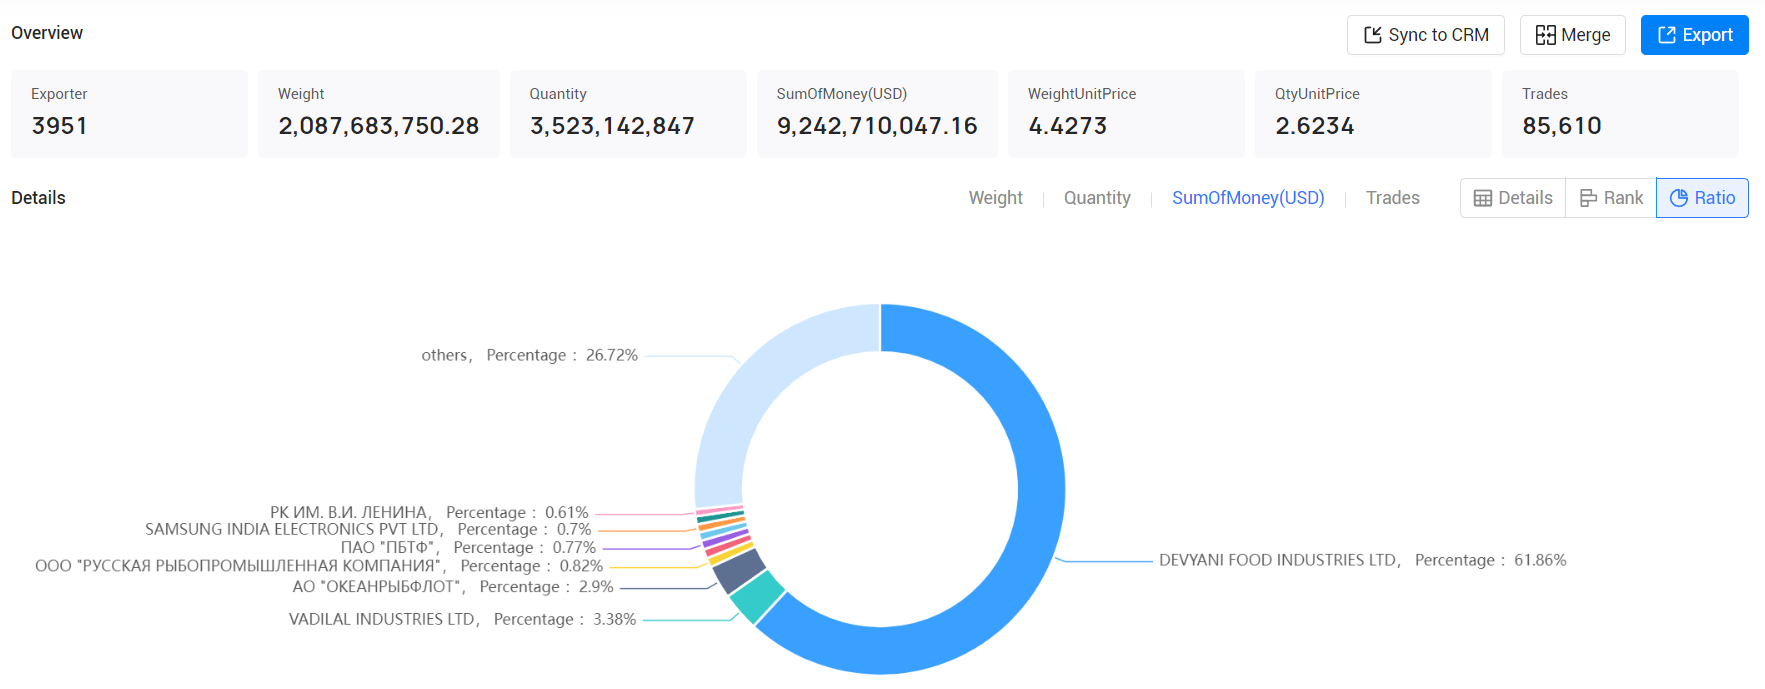
1. DEVYANI FOOD INDUSTRIES LTD: 61.86% ($5717.82 Million)
2. VADILAL INDUSTRIES LTD: 3.38% ($311.99 Million)
3. АО "ОКЕАНРЫБФЛОТ": 2.91% ($268.55 Million)
4. ООО "РУССКАЯ РЫБОПРОМЫШЛЕННАЯ КОМПАНИЯ": 0.82% ($75.62 Million)
5. ООО "РОЛИЗ": 0.8% ($73.87 Million)
6. ПАО "ПБТФ": 0.77% ($71.59 Million)
7. ООО ТК "РЕСУРС-ЮГ": 0.74% ($68.08 Million)
8. SAMSUNG INDIA ELECTRONICS PVT LTD: 0.7% ($65.11 Million)
9. АО "АКРОС": 0.7% ($64.31 Million)
10. РК ИМ. В.И. ЛЕНИНА: 0.61% ($56.3 Million)
These companies play a pivotal role in meeting global demand for ice cream, ensuring consumers worldwide can indulge in this delightful treat.

Global Market Analysis
Analysis of the Overall Trade Situation and Trends in the Industry
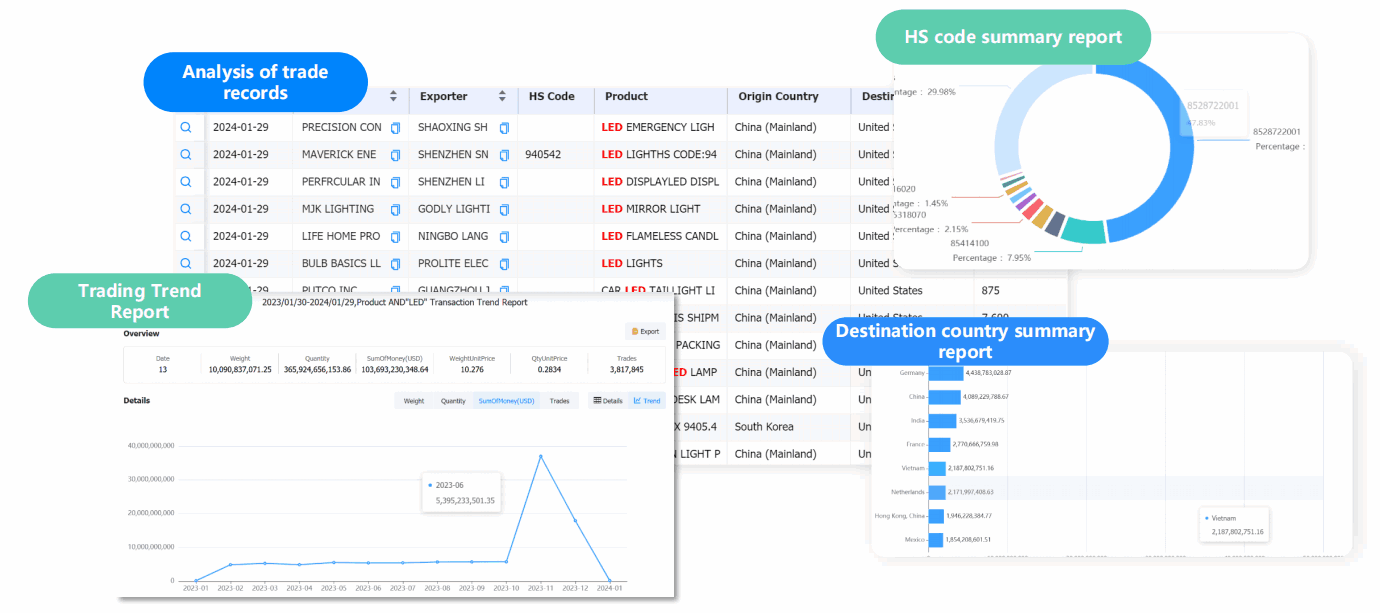
Through its powerful digital platform and in-depth reporting services, Tendata helps users to analyse the overall situation and future trends of the industry, so as to achieve more accurate market positioning and strategic planning.

Analysis of Specific Product Trade Trends in the Target Market
Tendata can provide comprehensive data support and analytical reports for analysing trade trends for a product in a single market, helping you to understand how that product is being traded in that market and identify business opportunities.

Category
Leave Message for Demo Request or Questions


 T-info
 T-discovery

 My
Tendata
 Market Analysis
 Customer
Development
 Competitor
Monitoring
 Customer Relationship


